STEM 1
In STEM 1, taught by Dr. Crowthers, we learn to read and understand technical research papers. We also conduct our own research project for science fair,
choosing to explore anything that is interesting to us. My project studies the light intensity of
Triplet-Triplet Annihilation Upconversion (TTA-UC) to better understand how to optimize its process.
TTA-UC is a chemical process that upconverts low-energy light to high-energy light, like red light to blue light.
To learn more about my project, check out my quad chart below!
Not able to view the PDF? Check out my quad chart here!
Modeling Annihilator to Sensitizer Ratios for
Optimal Light Intensity in TTA Upconversion
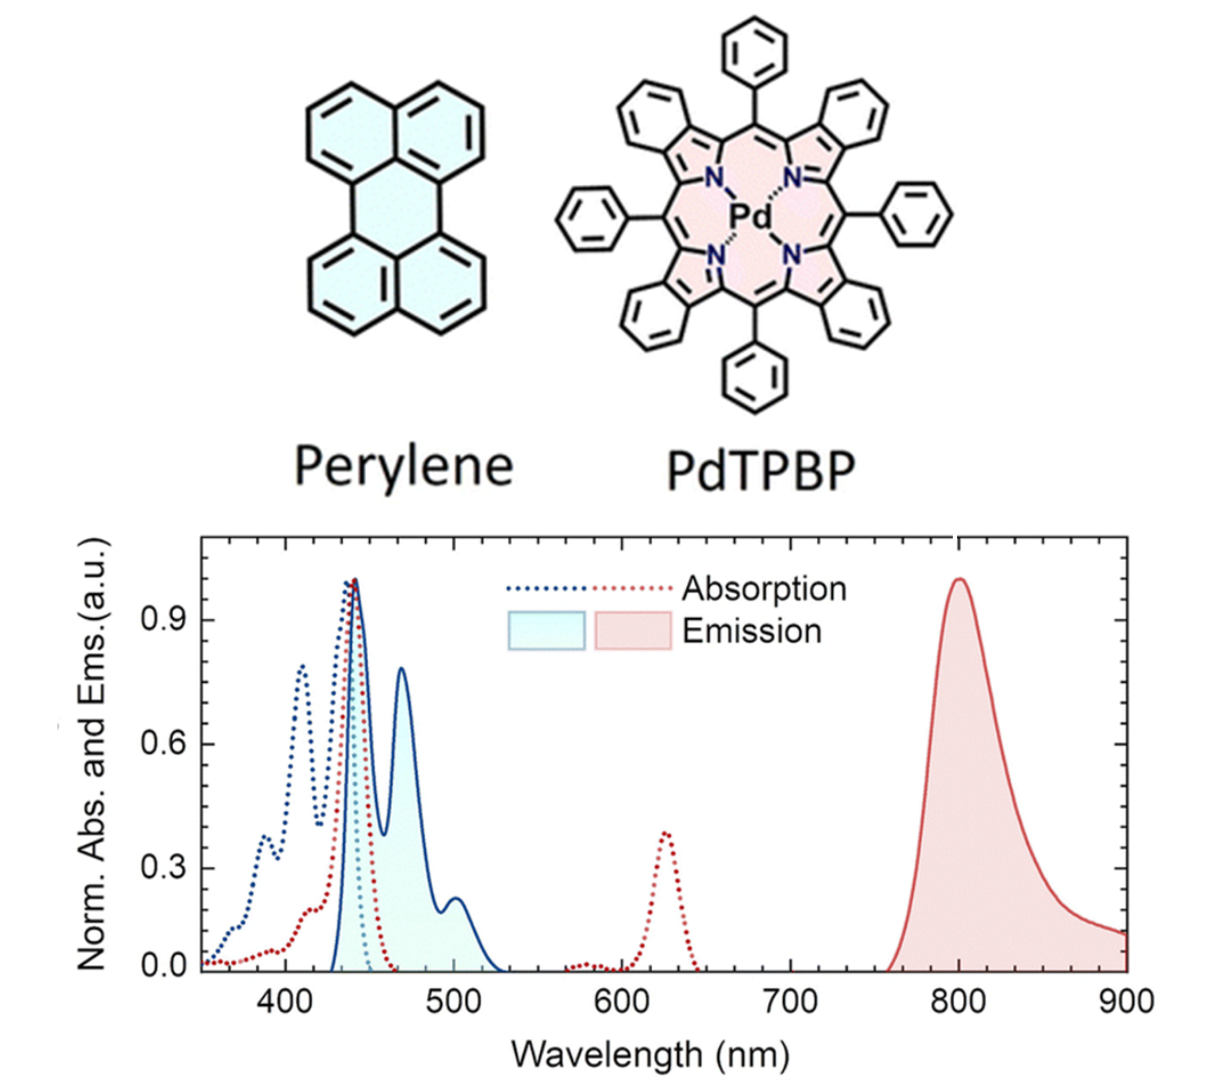
TTA-UC is an organic chemical process that uconverts low-energy light to high-energy light. It utilizes two molecules, a sensitizer and annihilator.
The ratio between sensitizer and annihilator directly affect the light intensity produced through TTA-UC. My project looks at this relationship and models
the effect of the ratio on peak light intensity for PdTPBP and Perylene.
Abstract
Triplet-triplet annihilation upconversion (TTA-UC) is the organic chemical process of upconverting low-energy light to high-energy light. This is done through the TTA-UC system, including the sensitizer, annihilator, and the solvent. The ratio of the sensitizer to the annihilator affects the efficiency of the system and primarily the intensity of the light produced. The optimal ratios for TTA-UC pairings are commonly known, but their effect on light intensity has not been well modeled.
The goal of this experiment was to test a variety of ratios for a sensitizer-annihilator pairing and model it on a graph, created to predict the light intensity from a given ratio. 6 different ratios of a TTA-UC system were observed using a spectrofluorometer to find how light intensity changes with an increasing amount of annihilator. It was found that doubling the amount of annihilator from 1:50 to 1:100 created 2.47 times increase on peak light intensity. However, increasing the concentration to 1:200 resulted in no light intensity being produced. It’s clear that light intensity and concentration do not have a liner relationship, but rather one that increases rapidly at first, then quickly drops due to inefficiency in the system.
Understanding how specific ratios affect light intensity is important because researchers do not always desire the brightest output. In biological applications, TTA-UC can be used for deep tissue imaging. However, if the upconverted light is too intense, it can cause damage to cells. Next steps include refining the model and expanding it to apply to different TTA-UC pairings.
Keywords: TTA-UC, sensitizer, annihilator, upconversion, wavelength, light
Research Question:
How does the ratio between annihilator and sensitizer in a TTA-UC system affect the peak light intensity produced?
Hypothesis:
Modeling various annihilator-to-sensitizer ratios in a TTA-UC system utilizing Perylene and PdTPBP demonstrates an
increasing light intensity as the ratio increases until the optimal ratio is reached, and light intensity begins to
decrease due to self-quenching.
Background
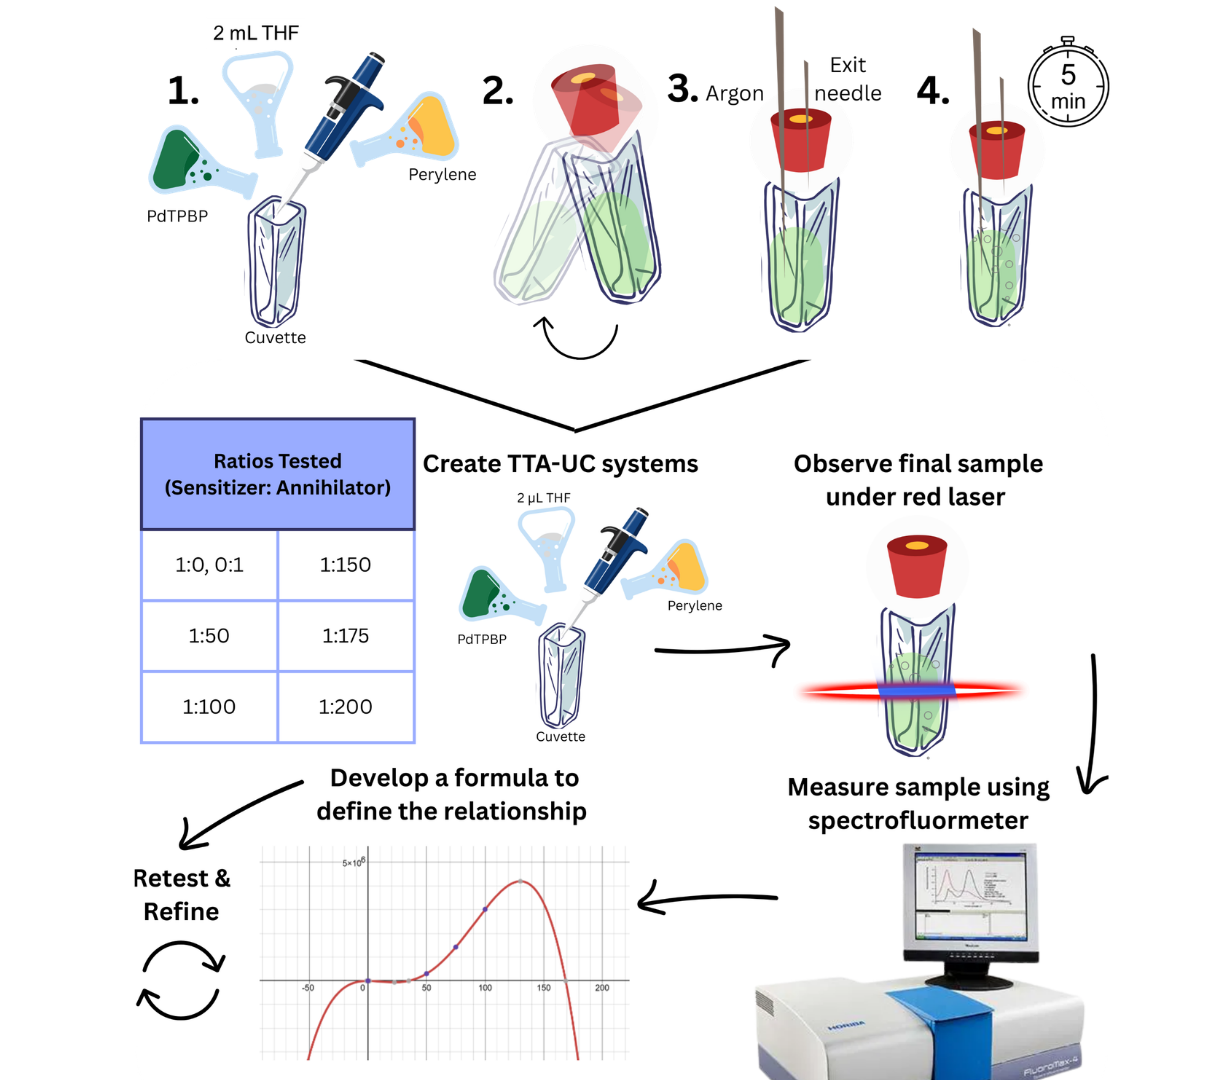
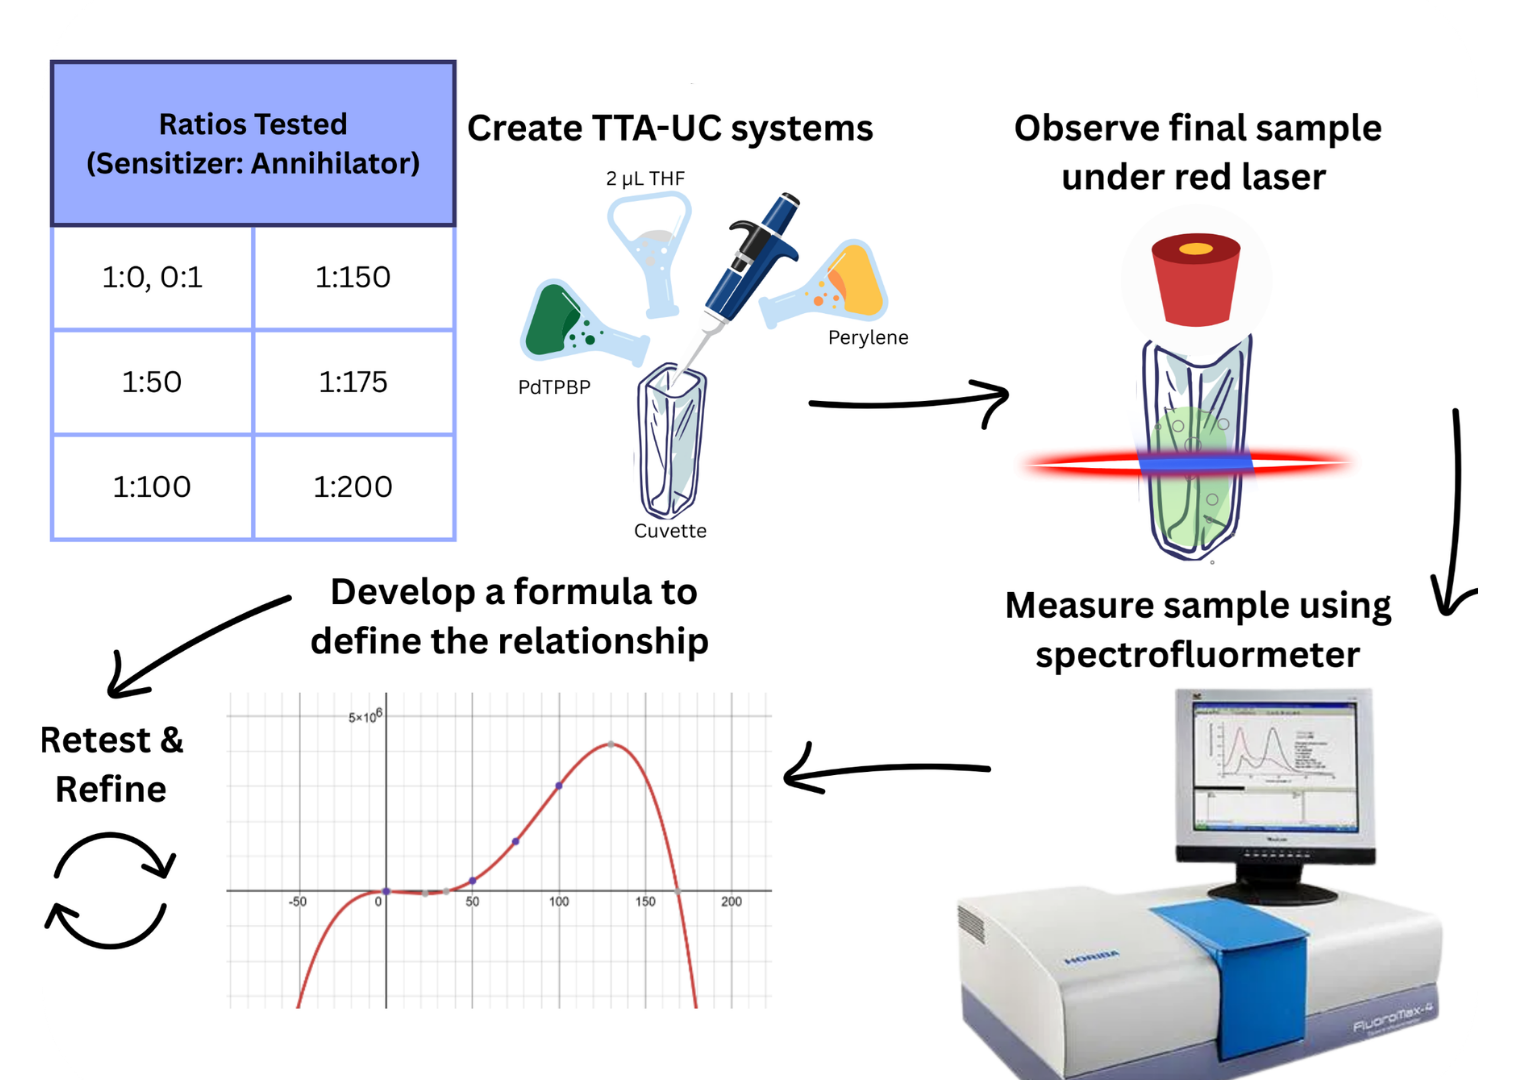
Procedure
Data
Analysis
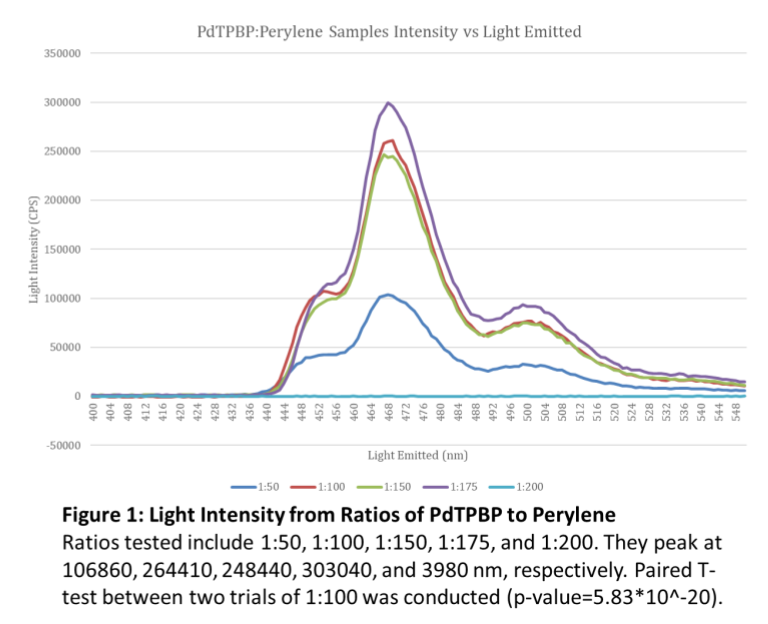
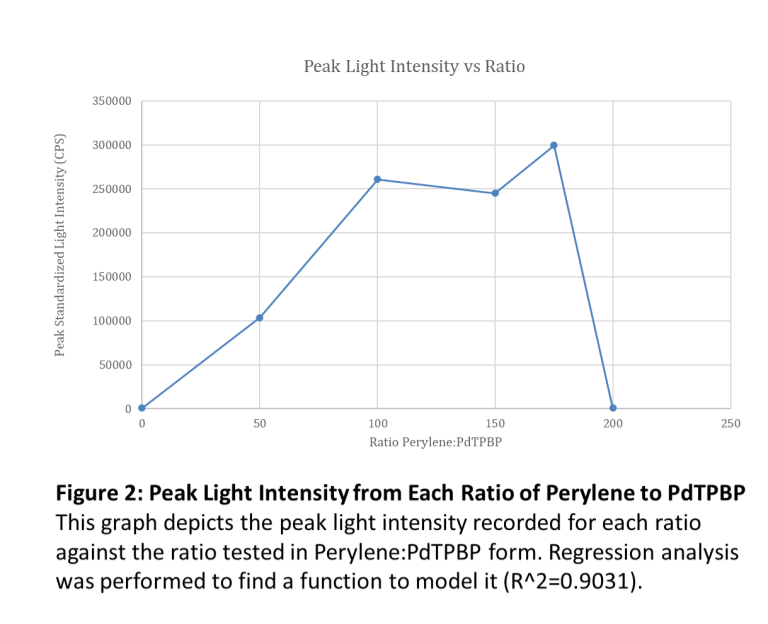
Analyzing the data finds that the relationship between the ratio and light intensity rises, peaks,
then rapidly drops off. As seen in the peak between the 1:50 and 1:100 graphs from figure 2, the 1:100 ratio has a 2.52
times increase in light intensity from the 1:50 ratio, though the annihilator has only doubled from 10.4 to 20.9 μL.
This disproves the idea that doubling the amount of annihilator would simply double light intensity, rather the relationship
is not one-to-one. Furthermore, the 1:175 ratio graph is only slightly higher at its peak at 303040 CPS. Between 1:150 and
1:175 the increase in light intensity slows down as it hits its peak ratio at 1:175.
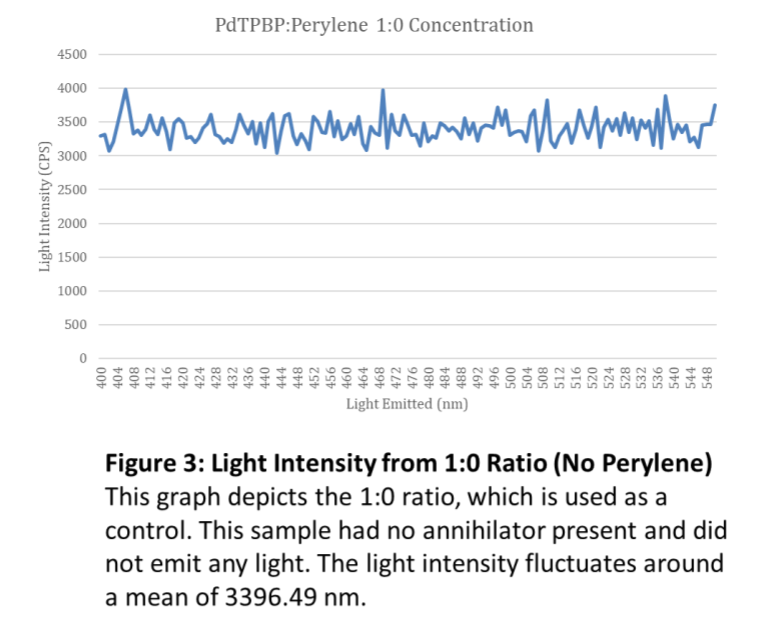
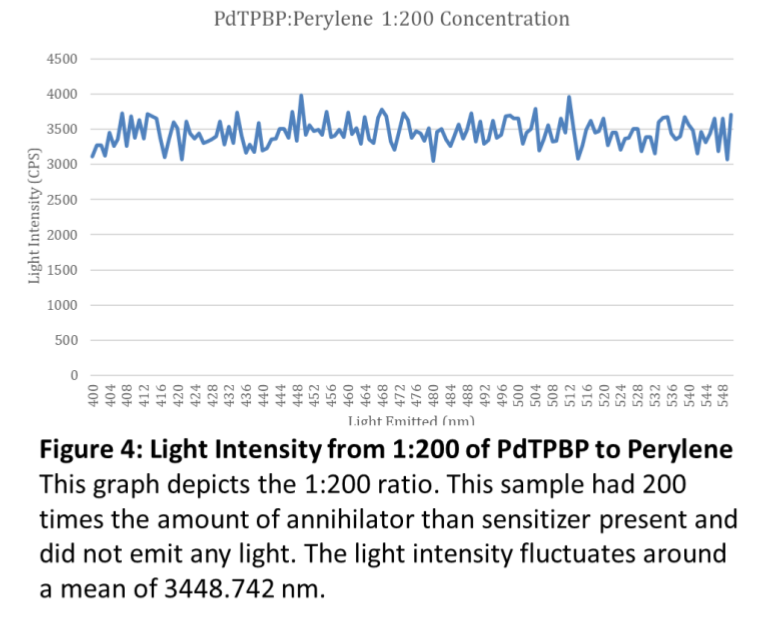
Meanwhile, adjusting the ratio to 1:200
results in no light intensity emitted as seen in figure 3. Both the control (from figure 1) and 1:200 ratio fluctuated around
3400 CPS, which is extremely low and undetectable to human eyes. Though the control emits no light due to no annihilator
present, the 1:200 sample emits no light for the opposite reason. The 1:200 sample is affected by self-quenching where
extra annihilator molecules are reabsorbing emitted light so that no light escapes the sample.
Discussion
References
February Fair Poster