Taught by Dr. Crowthers, STEM teaches us both about technical literature but also how to do research. During STEM I, I complete a research project on the topic of my choice. The projects are then presented as a Science Fair project. I have previously completed two other Science Fair projects which you can read about over at my Portfolio.
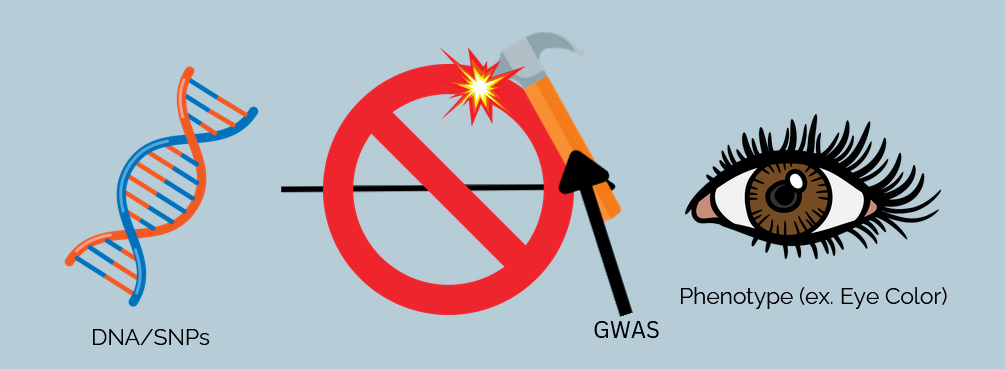
Although we have the entire genome, we have not currently and accurately linked their genes to gene expression or
phenotype (traits).
Identifying this link is important because gene expression controls essentially every single biological function,
and Identifying
links between genes and phenotypes would allow researchers to treat cancer, identify complex diseases, and more
(Creighton C. J., 2023).
However, this can also be difficult because there are lots of different variations to check (over 600 million!)
and multiple genes can contribute to a single trait (Jin et al., 2014).
The Graphlet Screening Method (GS) is a linear regression method implemented by Jin et al. in 2014.
It is much better than other regression methods at handling genomic data because it penalizes error more harshly
than other methods.
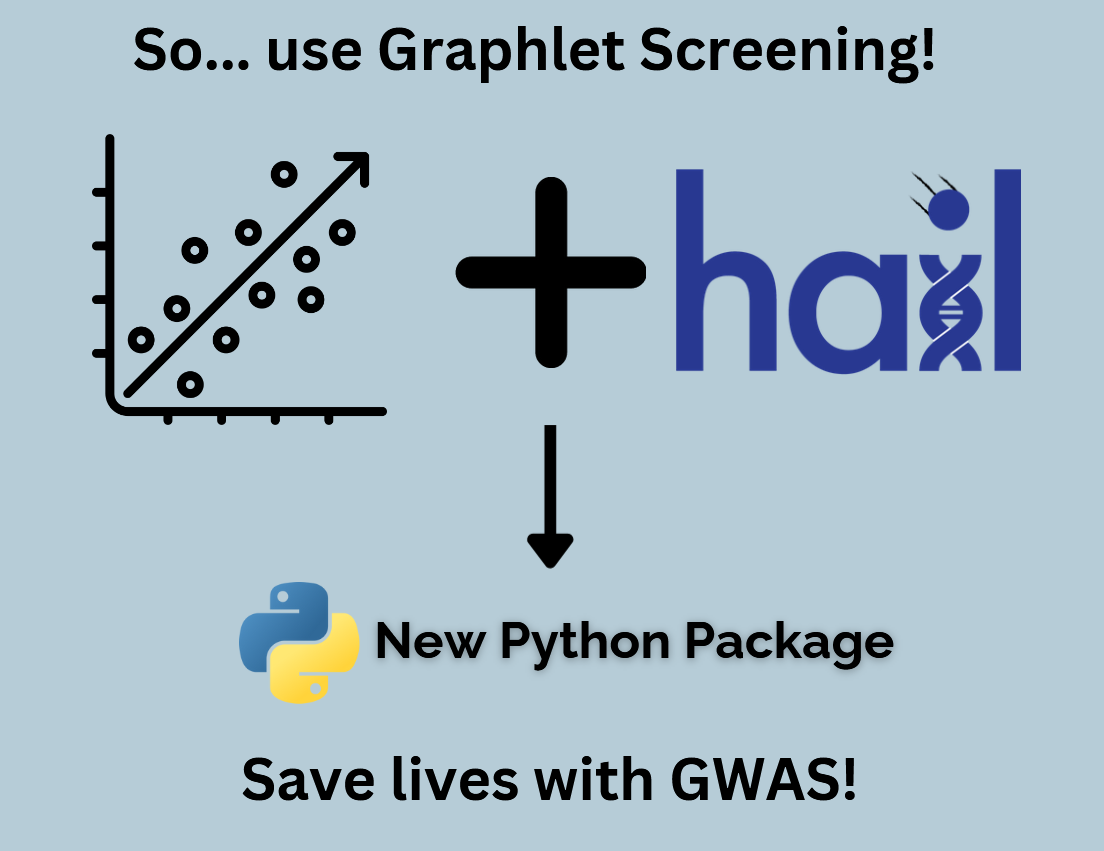
This projects aims to implement this method of regression into a current genomic analysis Python package (Hail)
and test its performance as a genomic analysis solution.
This project aims to implement an effective linear regression technique (Graphlet Screening) into genomic analysis. Improving linear regression in genomic analysis is crucial as it defines the correlation between genomic variations and phenotypic traits, which is the main objective of Genome-Wide-Association Studies (GWAS). GWAS help to identify and treat genetic disorders, among other utilities. Existing methods of regression, such as L0-regularization or LASSO, typically struggle with genomic data because the data tends to be weakly correlated and sparse. Graphlet Screening is better at analyzing this type of data thanks to its screen-and-clean procedure which more harshly penalizes error when compared to L0 and LASSO. However, it has never been implemented in genomic analysis before. This project implements and evaluates the algorithm by first running an independent test against other regression algorithms, then testing the algorithm with real genomic data and comparing it to existing GWAS by measuring the Hamming Distance and the runtime performance. To run in a genetic analysis environment, the Graphlet Screening method was converted from R to Python and integrated with another Python package (Hail). When tested against simulated genetic data, Graphlet Screening consistently outperforms L0 and LASSO.
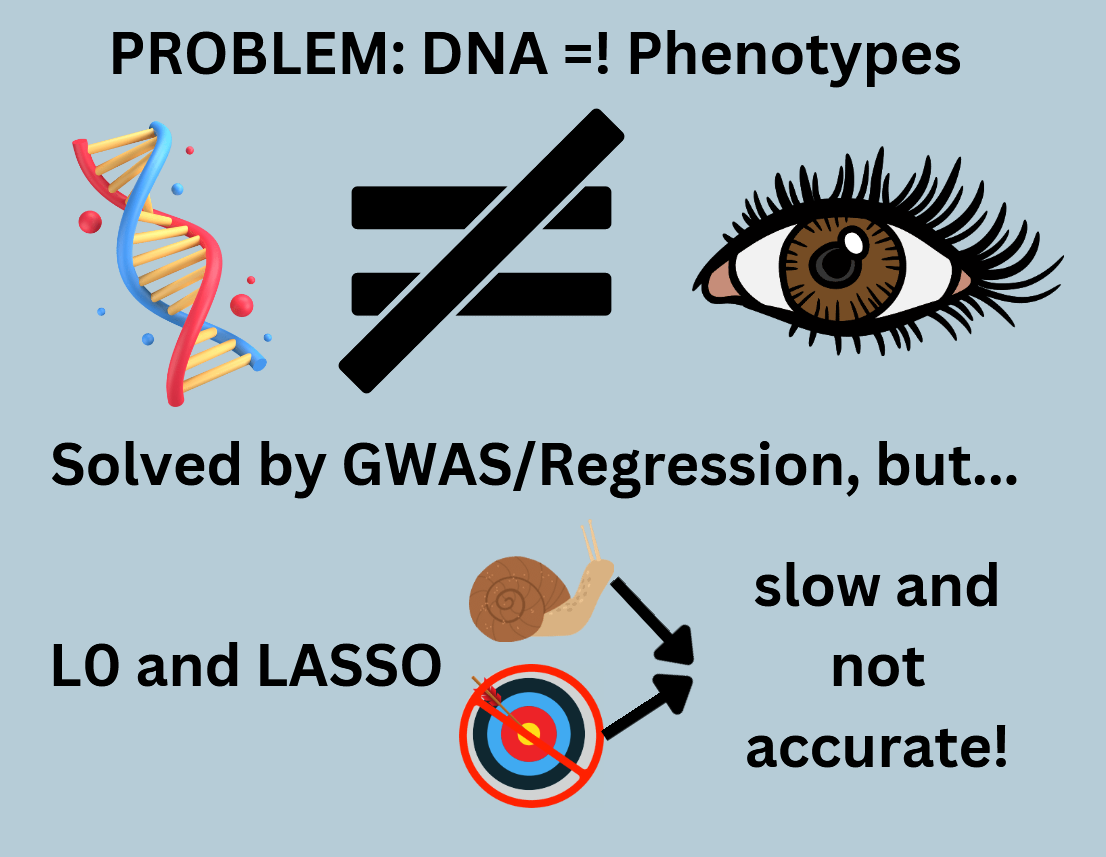
Current methods (L0, LASSO) used in Genomic Analysis are not accurate enough and do not penalize error enough to accurately determine the associated gene expression for SNPs (Horowitz, 2015).
Optimize the implementation of a new algorithm (Graphlet Screening) in an efficient genomic parser (Hail package) that is better at working with genomic data than the current gold standard algorithms in the industry to detect genomic signals more accurately.
Gene expression is important to understand because it controls every biological function.
Genome-Wide Association Studies (GWAS) aim to determine gene expression, helping tackle cancer and other complex diseases (Creighton C. J., 2023).
However, it can be difficult to run a GWAS because:
Lots of different Single Nucleotide Polymorphisms (SNPs, variations in DNA) contribute to a single trait
(Jin et al., 2014).
Each SNP contributes very little to the trait individually (Jin et al., 2014).
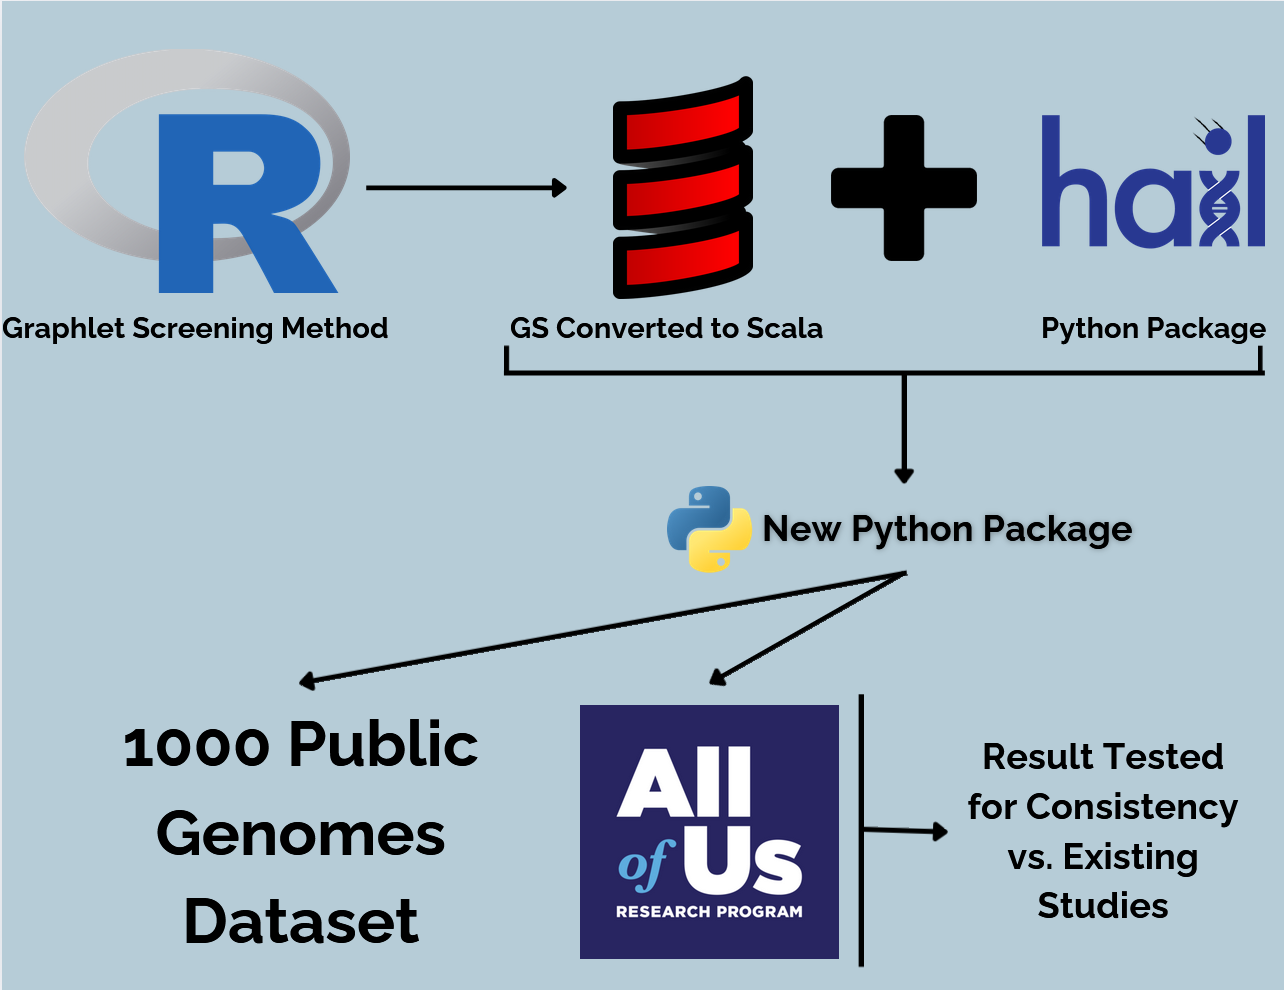
This project was split into 3 major phases:
Phase 1: Determine if the Graphlet Screening method is viable by running it through simulations against LASSO and L0-regularization
Phase 2: Integrate the Graphlet Screening Algorithm with Hail and test using the 1000 public genomes dataset
Phase 3: Use the combined Python package to analyze other real genomic data from the NIH "All of Us" database
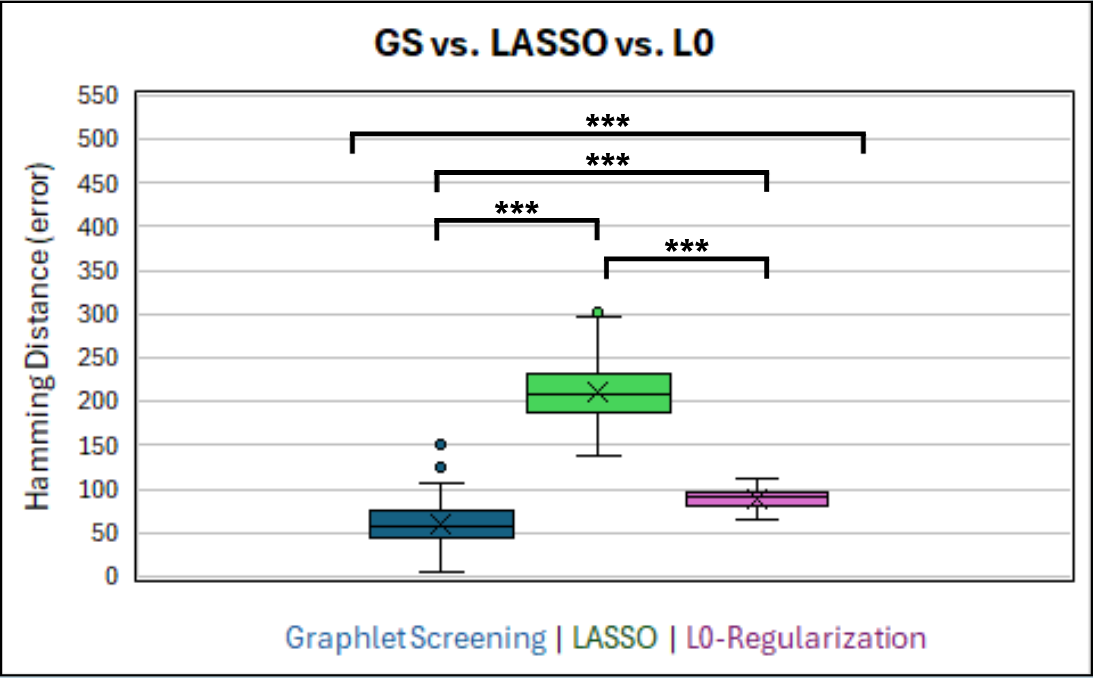
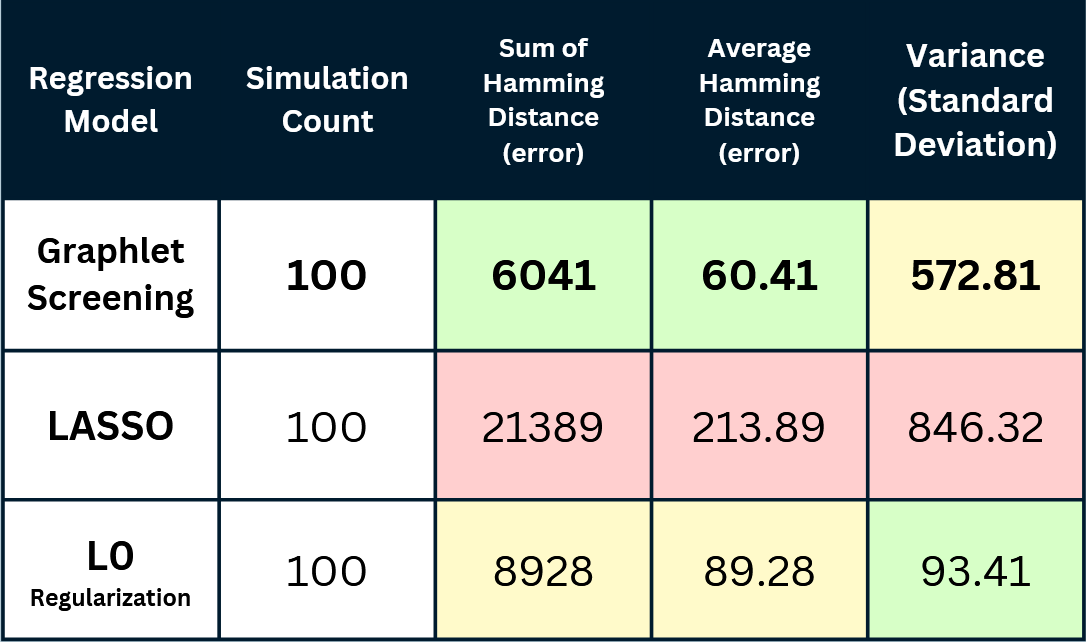
Hamming Distance represents the number of signals that the algorithm gets wrong during a simulation. Lower is better in this case.
Figure 2 and Figure 3 both show the results of a paired ANOVA test comparing the algorithms.
P-value: 1.7E-148
V (sparsity): 0.35
R (signal strength): 3.5
Generally, the Graphlet Screening method outperforms LASSO and L0-regularization. It is more accurate in
determining and connecting genomic signals. Its average error (hamming distance) was significantly and
consistently lower than the other algorithms, even when controlled for outliers.
This data showcases that the algorithm can make more accurate correlations between a design matrix and a response vector that were simulated to be similar in sparsity and signal strength to genomic data. However, it does not guarantee that there will be similar results in practical analysis. Further studies should evaluate the integrated model in practice by using actual, large-scale datasets and through comparison analysis.
