Students in Dr. Crowthers' research-based STEM 1 course do an independent six-month investigation on a topic of their own choosing. The course helps students navigate every step of the research process, from ideation to the final presentation, by emphasizing experimental design, research techniques, and scientific writing. At several levels, including school contests, regional WRSEF, state MSEF, and worldwide ISEF, completed projects are submitted to science fairs. This course teaches students how to write in a formal scientific style, perform thorough research, support assertions, create compelling scientific arguments, and present their work. Based on their own interests, each student independently plans, carries out, and delivers a research project.
Quad Chart
Implications of Neutrinoless Double Beta Decay for Models of Baryon Asymmetry
Project Overview
This research investigates the baryon asymmetry of the universe through the lens of neutrinoless double beta decay and the Type-I Seesaw mechanism. The project explores how experimental constraints can test models of matter-antimatter imbalance in the early universe.
Abstract
The baryon asymmetry of the universe, or the matter-antimatter asymmetry, is an open problem in the Standard Model. This research project focuses on the Type-I seesaw model, which postulates the existence of heavy sterile neutrinos to account for the light neutrino masses. Through the CP-violating decay of the heavy neutrinos in the early universe, a lepton asymmetry (leptogenesis) is produced, which is later transferred to the observed matter-antimatter asymmetry by sphalerons in the electroweak phase. Through the examination of experiments such as the neutrinoless double beta decay experiment, this research will attempt to determine if there exists a common parameter space that could fulfill all experimental constraints.
Video Abstract
Research Proposal
Research Objective
Can a Type-I seesaw model with heavy Majorana neutrinos simultaneously explain the baryon asymmetry of the Universe while remaining consistent with current 0vꞵꞵ and mixing constraints?
Hypothesis
There exists a region of heavy neutrino mass and CP-violating parameter space where sufficient baryon asymmetry is generated while avoiding exclusion by present 0νββ experiments.
Background
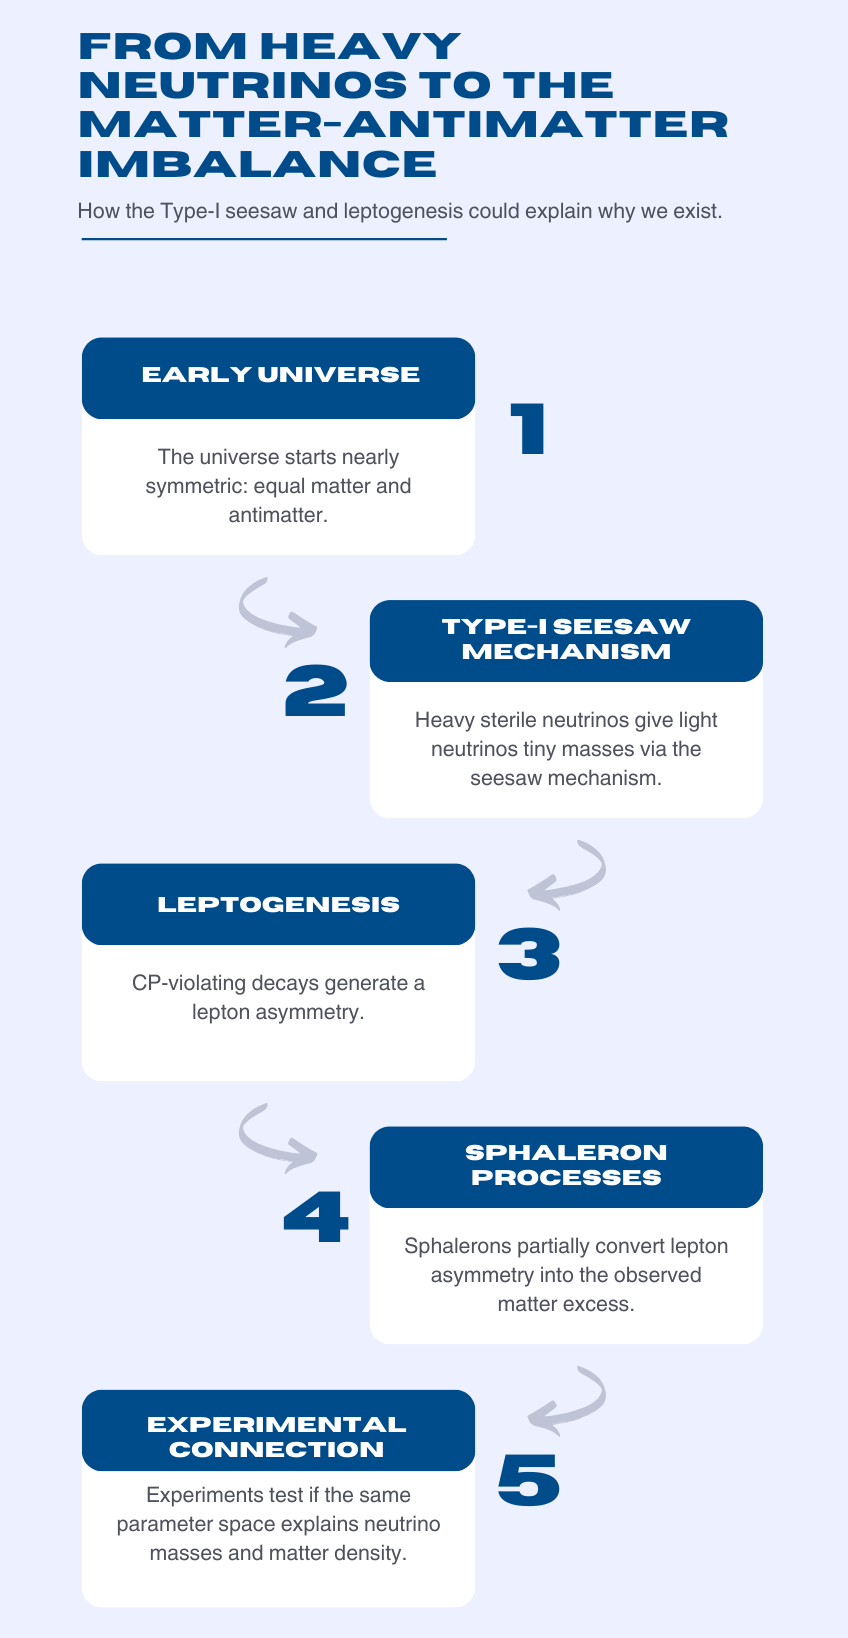
The baryon asymmetry of the universe, or matter-antimatter asymmetry, is a problem that is not addressed in the Standard Model. The research project will investigate the Type-I seesaw model, which assumes the existence of heavy sterile neutrinos to account for the mass values of the light neutrinos. In the early universe, the CP-violating decay of heavy neutrinos results in a lepton asymmetry (leptogenesis), which is later transformed into a matter-antimatter asymmetry due to sphalerons during the electroweak era. The project will attempt to identify whether there is a universal parameter space that fulfills the conditions of neutrino mass, the matter density of the universe, and experimental data.
Background Infographic
Procedure
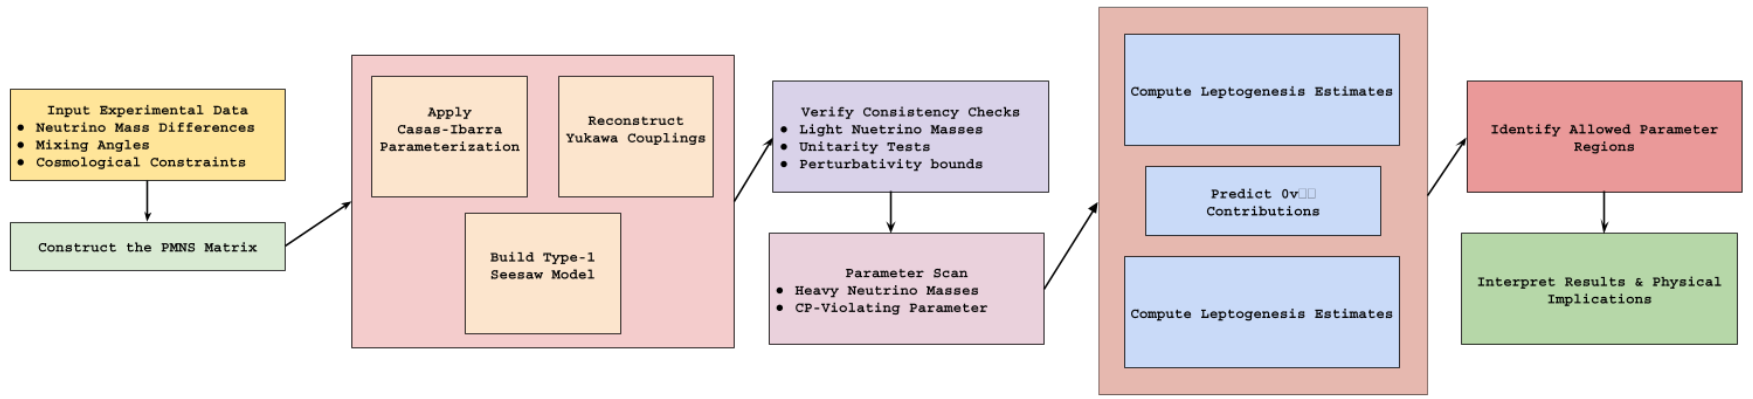
The inputs used in this project are derived from established experimental and theoretical neutrino physics. The oscillation parameters are obtained from global fits and Particle Data Group summaries, while baryon asymmetry is based on Planck measurements. The neutrinoless double beta decay constraints are based on experimental limits and nuclear matrix elements.
Procedure Infographic
Results
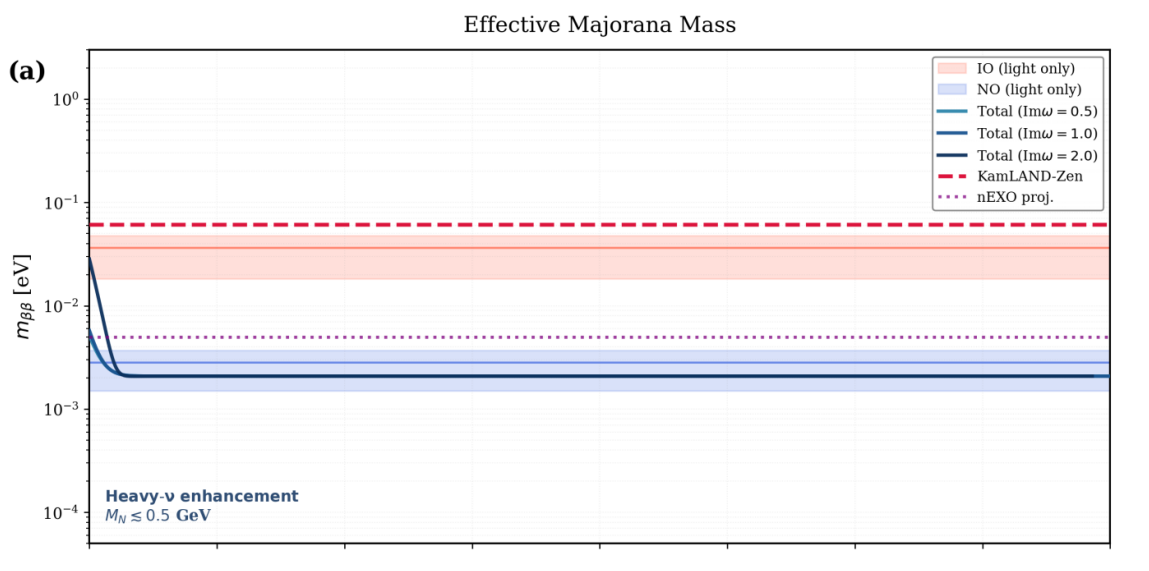
Majorana mass 𝑚𝛽𝛽 as a function of heavy neutrino mass 𝑀𝑁 , including light-only predictions for normal and inverted ordering, as well as total contributions including heavy neutrino exchange. The impact of heavy neutrinos increases the Majorana mass 𝑚𝛽𝛽 for heavy neutrino masses 𝑀𝑁 ≲ 0.5 GeV before decoupling at larger masses. The current KamLAND-Zen experimental bounds and future nEXO sensitivity partially cover the
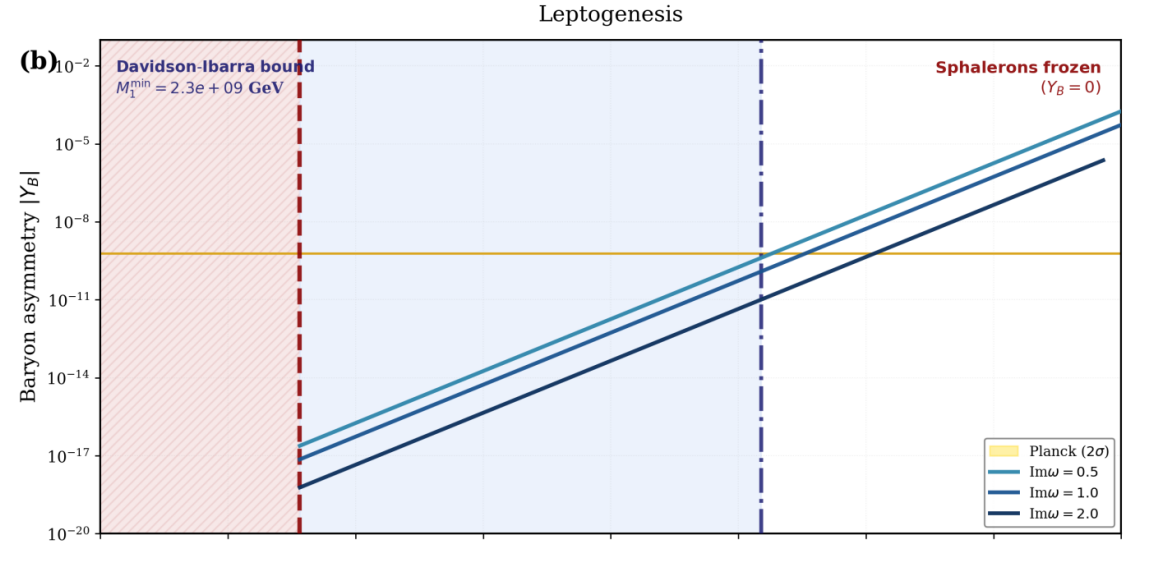
Predicted baryon asymmetry ∣𝑌𝐵 ∣ versus lightest heavy neutrino mass 𝑀1 for increasing CP violation Im 𝜔. Successful leptogenesis occurs only above the Davidson–Ibarra bound and before sphaleron freeze-out. Larger Im 𝜔 increases the asymmetry, with only a subset of parameter space reproducing the observed Planck value.
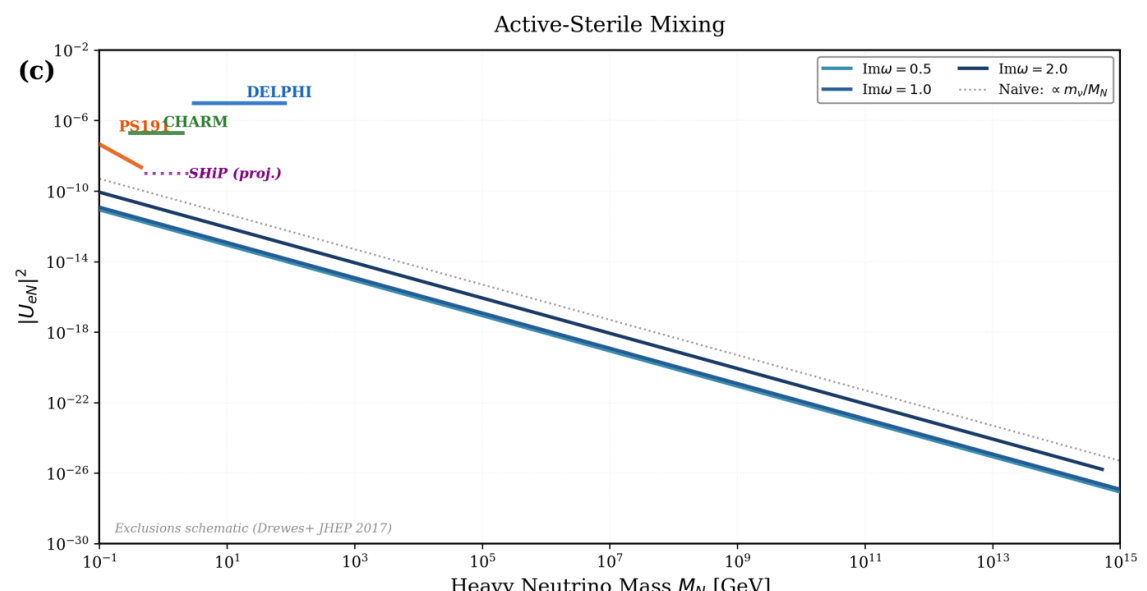
Electron flavor active-sterile mixing |𝑈𝑒𝑁|2 vs. heavy neutrino mass. Mixing scales as expected by seesaw and vanishes quickly with increasing mass. Theoretical predictions are below experimental limits from PS191, CHARM, and DELPHI, but are close to the expected sensitivity of SHIP at lower masses.
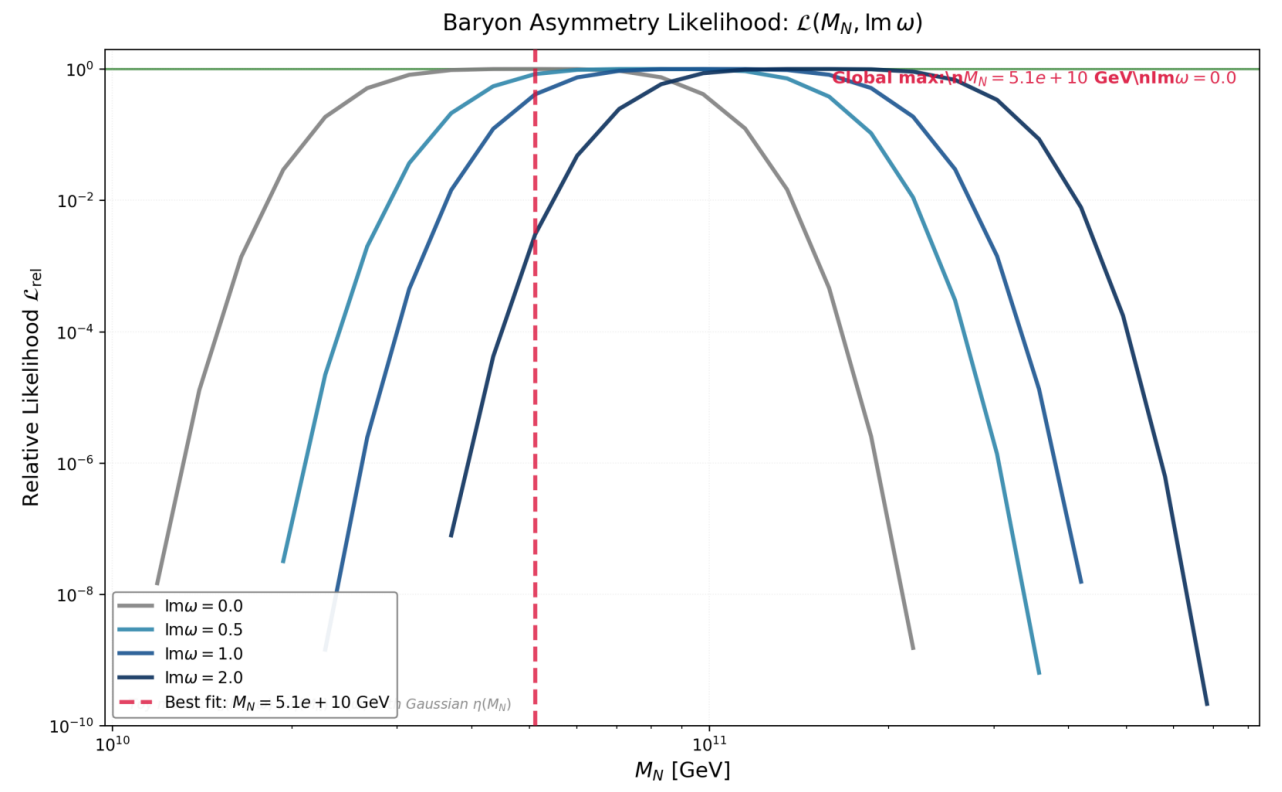
The likelihood is constructed from agreement with the observed baryon asymmetry and reflects the interplay between CP asymmetry growth and washout suppression.
Analysis
The scan of the parameter space shows that low-scale seesaw leptogenesis is very sensitive to CP-violating phases. The successful baryogenesis is possible only in a small region of the parameter space, which shows that the observed matter-antimatter asymmetry is not a generic prediction but requires a specific alignment with neutrino oscillation data. The predictions of active-sterile mixing and Majorana masses are still within the experimental limits but are close to the sensitivity limits of the future high-precision experiments.
Discussion/Conclusions
This work shows that the Type-I seesaw mechanism is capable of successfully combining the generation of neutrino masses with the observed value of the baryon asymmetry. Although the model is currently constrained by laboratory and cosmological observations, it is still viable and provides a target for future experiments on neutrinoless double beta decay and mixing. The region of the parameter space that has been found highlights a deep connection between the evolution of the early universe and low-energy neutrino observables.
References
Agostini, M., Benato, G., Detwiler, J. A., Menéndez, J., & Vissani, F. (2023). Toward the discovery of matter creation with neutrinoless ββ decay. Reviews of Modern Physics, 95(2). https://doi.org/10.1103/revmodphys.95.025002
Asaka, T., & Yoshida, T. (2019). Resonant leptogenesis at TeV-scale and neutrinoless double beta decay. Journal of High Energy Physics, 2019(9), 89. https://doi.org/10.1007/JHEP09(2019)089
Deppisch, F. F., Graf, L., Harz, J., & Huang, W.-C. (2018). Neutrinoless double beta decay and the baryon asymmetry of the Universe. Physical Review D, 98(5), 055029. https://doi.org/10.1103/PhysRevD.98.055029
Double-β Decay OMITTED FROM SUMMARY TABLE. (n.d.). Retrieved December 1, 2025, from https://pdg.lbl.gov/2021/listings/rpp2021-list-double-beta-decay.pdf
Drewes, M., & Eijima, S. (2016). Neutrinoless double β decay and low-scale leptogenesis. Physics Letters B, 763, 72–79. https://doi.org/10.1016/j.physletb.2016.09.054
Falcone, D. (2002). Seesaw mechanism, baryon asymmetry, and neutrinoless double beta decay. Physical Review D, 66(5), 053001. https://doi.org/10.1103/PhysRevD.66.053001
Hernandez, P., Kekic, M., & Lopez-Pavon, J. (2014). Neff in low-scale seesaw models versus the lightest neutrino mass. Physical Review D, 90(6), 065033. https://doi.org/10.1103/PhysRevD.90.065033
Jones, P. (2021). The physics of neutrinoless double beta decay: A beginners guide. https://doi.org/10.22323/1.388.0007
Klapdor-Kleingrothaus, H. V., Dietz, A., Harney, H. L., & Krivosheina, I. V. (2001). Evidence for neutrinoless double beta decay. Modern Physics Letters A, 16(37), 2409–2420. https://doi.org/10.1142/s0217732301005825
Sanford Underground Research Facility. (2018, December 21). A primer on neutrinoless double-beta decay. https://sanfordlab.org/news/primer-neutrinoless-double-beta-decay