next up previous
Next: Module 1 Mini-Project Up: Module 1: Introduction Previous: Discussion Questions

Exercises

  1. A certain news organization takes two kinds of polls of voter preference:
    1. Prior to election day, prospective voters are polled.
    2. On election day, voters who have just voted are polled (this is known as an exit poll).

    One of these polling methods definitely results from a stable process, the other may be unstable. In two sentences, tell which is which and why.

  2. In a metal stamping process there are three machine operators operating identical machines making identical parts. A study of the waste produced by the process reveals that the great majority of process variation is between operators rather than within operators. Sketch what a stratified plot of the data from this process might look like.

     
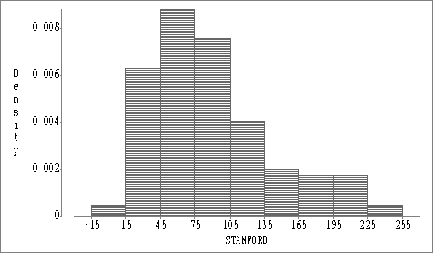
    Figure:   Stamford Ozone Readings

  3. A large supermarket receives complaints about the quality of its baked bread. Suppose you are in charge of the bakery. Develop an Ishikawa diagram that could help you locate the causes of the poor quality.

  4. Are data (i.e. measurements) needed to construct an effective Ishikawa diagram? If so, why? If not, what is needed?

  5. Figure gif displays ozone readings taken at Stamford, Connecticut over a 120 day period. A MA 2611 student claims that the graph shows the ozone levels to be from a stable process. How would you answer her?

  6. The file SASDATA.UNEMGNP contains (among other variables), the quarterly unemployment rate for the US (variable URATE) from the first quarter of 1946 through the second quarter of 1991 (variable DATE). Is the process that generated these data stable? Provide an appropriate plot and justify your answer.
  7. A bakery finds that there is too much variation in the weights of its one pound loaves of white bread. Production specifications call for a weight of pounds. The weight of the dough going into a loaf of bread is controlled by a scale. There are two potential problems with the scale: worn gears or mis-calibration. The first problem results in excessive variation in the weights, while the second results in the weights being off target. The data set SASDATA.BREAD contains the weights of eight randomly selected loaves from each of the bakery's ten scales.
    1. Produce one appropriate plot showing the variation for each of the scales.
    2. Tell which kind(s) of problem(s), if any, is (are) associated with each scale by putting a check in each box corresponding to a scale with the designated problem (leave empty any box for which a given scale does not have that particular problem):

  8. Three machines are designed to produce washers which are 2 mm thick. A random sample of 20 washers is taken from the day's production of each machine. The data are displayed in Figure gif.

     
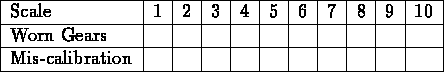
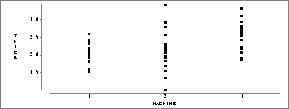
    Figure:   Thickness Versus Machine for Washer Production

    (a)
    Describe the variation in the data.
    (b)
    Explain the possible causes of the variation in the data? [Hint: Consider worn parts, drift, calibration or operators.]

  9. The SAS data file SASDATA.DERBY contains the winning time, owner name and horse name of all Kentucky Derby winners from 1875 through 1980. Access this data set using SAS/INSIGHT .
    1. Do the winning times appear to be the result of a stable process? Why or why not? Supply one appropriate plot to support your claim.
    2. Summarize one other aspect of the data's behavior.
  10. In a certain factory workers come in three shifts: 7:00am to 3:00pm, 3.00pm to 11:00pm, and 11:00pm to 7:00am. The data set, SASDATA.FACTORY, contains the percentage of nondefective items produced for each shift during a ten-day period.
    1. Draw an appropriate plot to compare performance during the three shifts.
    2. How might you explain the variation in the data?

  11. Look at Figure gif. Describe the trend summarized by the moving average. What events do you think are responsible for some of the features you describe?

  12. Look at Figure gif. Describe the trend summarized by the moving average. There are two places where the moving average jumps substantially. What events do you think are responsible for the jumps?

  13. Professor P. is at it again! The data set SASDATA.COMMUTE contains the times (in seconds) it took him to commute from his house to WPI on a number of recent occasions. Is the process that generated the data stable? Make an appropriate plot to decide.

  14. Come up with two ways you can make use of data to improve the quality of your life. Tell how you would collect and display the data.


next up previous
Next: Module 1 Mini-Project Up: Module 1: Introduction Previous: Discussion Questions


Joseph D Petruccelli
Tue Feb 21 14:15:46 EST 1995