ME 3901 Engineering Experimentation
Mechanical Engineering Department
Worcester Polytechnic Institute
Temperature Measurements
· Ideal Gas
· Mechanical Effects
· Electrical Effects
· Thermistors
· Thermocouples
· Thermopiles
· Conversions
Temperature Measurements
- Pressure, volume, electrical resistance, expansion coefficients… are all related to temperature through their fundamental molecular structure
- They change with Temperature
- Therefore, they can be used to measure temperature, i.e. they can be surrogates for temperature.
PV = mRT
Take a fixed volume filled with a gas.
Expose it to a known temperature standard and measure the pressure.

Now expose it to an environment of unknown temperature and measure the pressure.
PuV = mRTu
PsV = mRTs
Pu/Ps = Tu/Ts
Tu = Ts (Pu/Ps)
Using pressure to measure temperature can be accurate to within 1 degree K, especially for very low temperatures.
Consider a typical thermometer
Capillary tube
Alcohol (low temperatures, greater coeff. of expansion)
Mercury (high temperatures)
Error?
Account for expansion of glass surroundings.
Usually calibrated for a certain depth of immersion.
Bimetallic strip?
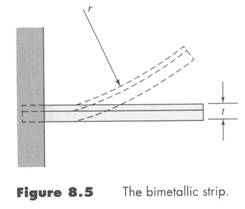
The curvature radius, r, is calculated as:
r = f(expan. coeffs., thicknesses, Es, T, Toriginal_bond)
This device is typical for thermostat applications
Very useful – a signal is produced that is easily detected, amplified, and/or used for control purposes
RTD – Resistance Temperature Detector
Generally, resistance of an element changes with temperature
R = R0(1+aT+bT2)
where R0 is the reference resistance measured at Treference, frequently 0 deg. C.
High grade RTDs use bridge circuits to eliminate lead resistance changes in the same way that strain gages use bridge circuits.
Thermistors – semi-conductor devices.
They have negative temperature coefficients of resistance (whereas most other materials have a positive coefficient)
The behavior follows an exponential variation
R = R0 exp[b(1/T – 1/ T0)]
where 3500K < b < 4600K usually
Very consistent and sensitive. Once calibrated it provides consistent performance within 0.01 oC
Highly nonlinear – not a problem with data acquisition systems.
Thermoelectric Effects (Thermocouples)
– the most common temperature measuring device.
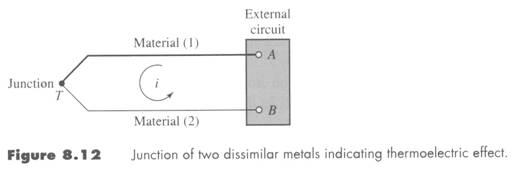
This thermoelectric effect is known as the Seebeck effect.
Certain rules or laws apply for thermocouples (T/C)
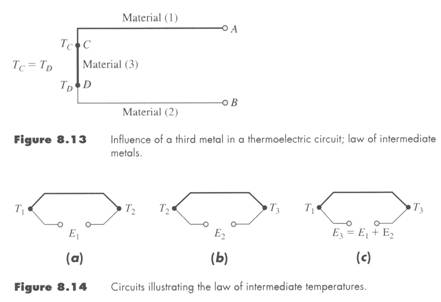
1.) if a 3rd metal is connected in a circuit the net emf (voltage) is not affected provided the temperature connections with the 3rd material are the same, law of intermediate metals.
2.) Law of intermediate temperatures – temperatures do NOT add; however, voltages DO add.
All T/C circuits involve at least two junctions. If one junction is known, then the other can be calculated.
An ice-bath is very common and accurate reference junction.
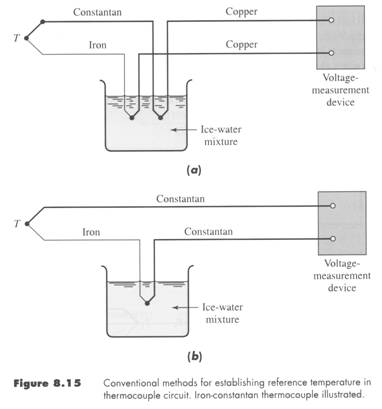
The ice-bath configuration in 8.15a is the best to use. It does not require the voltage-measuring device (+) and (-) terminals to be at the same temperature. Figure 8.15b is also fine provided that the voltage-measuring device (+) and (-) terminals are at the same temperature.
An ice-bath reference is ideal. It is easy to construct and maintain. Most reference tables are based on a 0oC reference temperature.
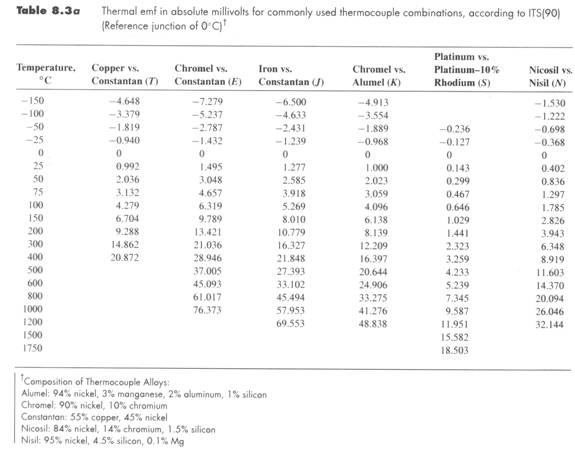
This temperature to voltage relationship (in Table 1 from Nat. Instruments) has been expressed in polynomial form such that T = f(V), where T is oC and the voltage is in microVolts.

The errors listed in Table 1 are due to the regression coefficients.
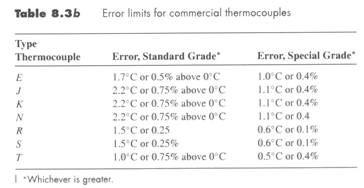
The errors listed in Table 8.3b are due to the material variations of the thermocouple.
This relationship can also be reversed to relate voltage to temperature, i.e. mV = f(T). Table 2 (from NI) calculates microVolts for a temperature input in oC.

The range of each thermocouple is limited. The following table (8.17 of Holman) delineates these ranges. Table 8.3a showed the millivolts output for each T/C type in the given temperature range. These values can be used to determine which T/C is best for the required application range.

If the millivolts range is too small, or one simply wants a more accurate reading, one can use a thermopile, i.e. add the voltages of each T/C in series to increase the accuracy.
Note that a thermopile assumes that T1 and T2 are constant. The averaged voltage generated by the thermopile is used to determine the temperature difference between the two thermal sources.
This device is frequently used in wind tunnels to report temperature or ventilation ducts and other locations.
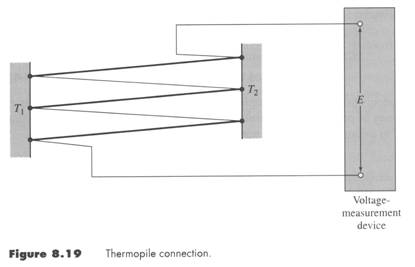
Whether using a thermocouple or thermopile, the voltage generated is a function of the temperature difference between the two junction locations, the thermocouple tip and the voltage card, or the thermocouple tip and the ice-bath junction, or T1 and T2 as in Fig 8.19.
The textbook tables assume a reference temperature, usually 0oC. Therefore, one must know the temperature of one junction to determine the temperature of the other junction.
Consider the following situation for a type T thermocouple (using Table8.3a): Assume the Tright is known.
Tleft=75 oC 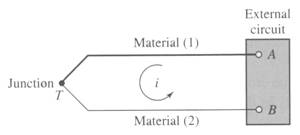 Tright = 100 oC
The voltage detected at the external circuit board is -1.147mV. This value would indicate that the left temperature is lower than the board temperature, Tright. But the mV value cannot be used directly to calculate the temperature difference. One needs to know that the board is at 100 oC which would produce 4.279mV relative to a 0oC reference. This mV value is used to determine that the left side is at (4.279-1.147) 3.132 mV relative to a 0oC reference, which corresponds to a temperature of 75 oC.
In general one must use Table 2 to convert the known temperature at one junction to a voltage relative to the Table’s reference temperature. This voltage is added to the ‘voltage-difference’ detected by the voltmeter or potentiometer to establish the voltage of the unknown temperature junction relative to the reference table. Then use of Table 1 converts the voltage relative to the table to a temperature value.
oF = (9/5) oC + 32.
oR = (9/5) K
K = oC + 273
oR = oF + 459.56