PH 1121 Lab 1: Electric Fields and Equipotentials
Introductory Comments
This Lab report is to be submitted on-line using myWPI. To do this will present a modest challenge, since some graphics will be required. I encourage you to take some time to at least try to create realistic "pictures" of the work you will do in the lab and that is requested for this and the next report. Use whatever "drawing" utility you like or are familiar with. Powerpoint and Paint are two such options, though there are many others. Raw data on the conducting paper can be photographed and *.pdf files can be made.
Please note that the suggested tables are incomplete and will need to be expanded by you. As well, you should learn a little about the Equation Editor provided in Word or the equivalent editor that you are using. You should be able to simply copy-paste any table presented into a Word document with little trouble.
This is the first part of a two-part Lab and report. In your final version I would Like to see Part I clearly labeled. Part II, also clearly labeled, should follow it, all in the same file. Any scanned raw data should follow these two parts and be carefully labeled so that the grader will know to what it refers in the body of the text.
This two-day Lab exercise will be written-up as one report to be due Friday evening preferably before mid-night. You are strongly encouraged to begin your write-up promptly for two reasons: (1) This report may take you more time than anticipated, and (2) There are many bits of Logistics you will need to cope with: scanning raw data and attempting to draw some graphics using a computer.
Objectives
- To locate, Experimentally, the equipotential lines between parallel plate conductors and concentric cylindrical conductors.
- To sketch some of the lines of the Electric (E) field and show their direction.
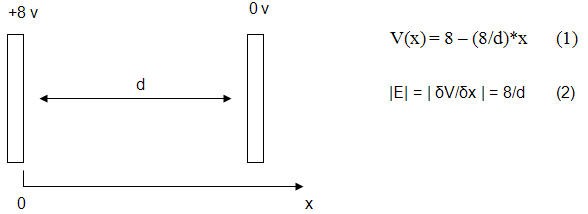
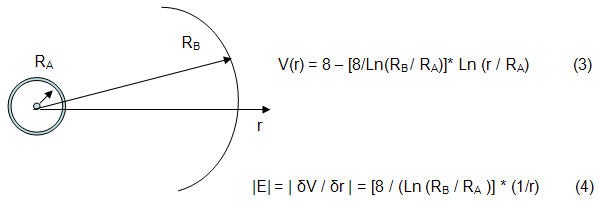
- To compare the experimental values of voltage (V) and |E| with those predicted by the following equations:


Overview
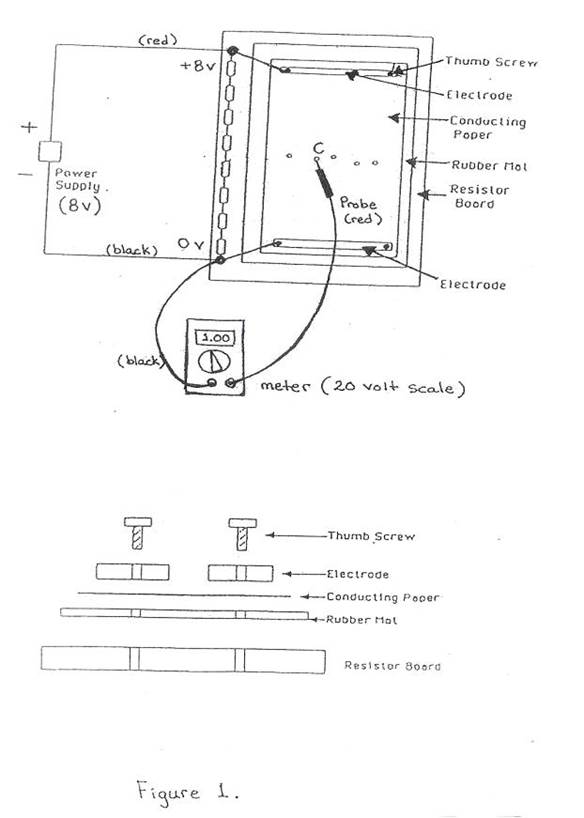
Metallic electrodes are placed on top of special conducting paper, which is in turn placed on a rubber mat, and the entire arrangement is secured to a wooden resistor board for support. An electric field is produced in the paper between the electrodes by connecting the electrodes to a potential source (see figure below). Points of equipotential in this field are found with the red probe of a sensitive multimeter (set to the 20 v DC scale) by finding all the points on the paper having the same potential (or voltage). Observe points C in the figure.

Procedure
Configuration 1
Place the straight electrodes on a new sheet of conducting paper with the "bite" edges facing inward (towards each other), place the paper on the rubber mat and secure the whole arrangement tightly to the wooden resistor board with the thumb screws (bottom of previous figure). Be sure that the conducting paper is as smooth and flat as possible. Adjust the power supply to roughly 8 volts using the power supply's built-in meter. Place the red probe of the multimeter (set to the 20 V DC scale) on the electrode connected to the + (red) side of the power supply, and then fine adjust the voltage until the meter reads +8.00 v. The black and red wires from the electrodes of the power supply allow a potential difference of 8 volts to be established in the paper between the electrodes.
Measure the separation, d, of the bite edges.
The red probe of the multimeter is used to detect potentials (voltages) in the conducting paper. The probe is carefully touched to the paper (making good contact without tearing or puncturing the paper) at various points until the desired voltage is found and that point is marked with a white pen (again do not damage the paper). The set of points for a particular voltage is the equipotential curve for that voltage.
Find the equipotential curves of 1, 2, 3, 4, 5, 6 and 7 volts using a minimum of 6 points each.
Configuration 2
Repeat the above procedure using the a ring and disc as the electrodes, with the ring connected to zero volt (black) terminal and the center disc to the +8 volt (red) terminal.
Measure the diameter of the disc (RA = d/2) and the inside diameter of of the ring (RB = d/2). Make a pair of copies of each conducting paper using carbon paper.
Calculations
- Before actually locating the equipotentials try to infer their shape from that of the electrodes.
- In each configuration, draw smooth curves on the conduction paper (after the experiment) for each equipotential curve.
- From the equipotentials, draw several electric field lines. Remember the electric field lines are always perpendicular to the lines of the equipotential (why?). Be sure to put arrows on the electric field lines in the correct direction. Do the field lines point to higher or lower potential?
- The value of the electric field can now be determined, using a ruler. The exact expression for the component of the electric field along the s direction is Ex = δV/δs. For our experiment we write this as a finite difference equation for the magnitude of the electric field: |E| = |ΔV| / |Δs|, where |Δs| is the distance between successive equipotentials and |ΔV| is the potential difference between them. What are the ΔV's in this experiment? Since we are calculating |Es| using finite differences, (Δs, rather than infinitesimals ds) we might wonder at what point the |Es| takes on the this value of |ΔV| / |Δs|. This point will be approximately midway between the two equipotentials use to calculate |Es|.
- Construct two tables; Ia for the parallel plates and Ib for the ring/disc configuration, using the template here.
- Construct two additional tables: IIa for the parallel plates and IIb for the ring/disc configuration for the predicted equipotential and the electric field values obtained from equations (1), (2), (3) and (4), respectively. The constants d, RA, RB, should be taken from your data. A template for these tables can be found here.
- For the parallel plate configuration plot two graphs; V vs. x and |Ex| vs. x. You supply the precision graph paper. Do not use awkward scales. Use the predicted values from Table IIa to construct smooth curves. Then plot the experimental values from Table Ia as discrete dots.
- For the ring/disc configuration plot 2 graphs; V vs. r and |Er| vs. r. Use the predicted values from Table IIb to construct smooth solid curves. Note: To achieve the desired smoothness it will be necessary to include several extra points in table IIb in the region where the curves of V and E bend rapidly with r. Then plot the experimental values from Ib as discrete dots.
Writing Your Report
Your completed lab report should be submitted on Canvas as either a PDF or DOCX file, though PDF results in fewer uploading errors. It should include the following:
- A cover page with all the information recorded at the top of your datasheet: experiment name, your name, your partner's name (so designated at as partner), conference number, conference Instructor, date of Lab and the due date for the report.
- Tables in a neat final form. To help ease the burden of grading please use the same table numbers, titles, and row and column arrangements as provided by the lab instructions. Note that in this incremental difference approach, the values of |Es| correspond to points half-way between the equipotentials.
- One sample of each of the more elaborate calculations showing:
- the formula in symbolic form;
- the same formula with numerical values and units substituted for the symbols;
- and numerical results with units.
- Graphs, preferably created with a program such as Microsoft Excel, Maple, Matlab, or similar.
- Provide a variable name or symbol with units and a scale for each axis. Do not use an awkward scale. Use one that will let you plot to a fraction of the smallest division using visual interpolation alone.
- Indicate the predicted relationship with a smooth solid curve.
- Indicate a measured quantity with a "dot" for each datum point.
- Each graph must have a title and a caption.
- Diagrams, freehand sketches of the lines along which V is a constant and electric field lines for each of the two electrode configurations as determined from measurements on the conducting sheets. Label the voltage of each equipotential (including 0 and +8V) and show the vector direction of the electric field lines with arrow heads.
- Discussion and Conclusions: Look at the four graphs. Comment on the agreement between the predicted and experimental values. Do the disagreements appear to be systematic or random? Comment on sources of error you have noticed or can think of. The precision with which you measured Δs was probably 1 or 2 mm. Is this uncertainty in Δs sufficient to account for differences between theory and experiment? Explain, perhaps with an example.
- Each partner's lab report should include photos of the conducting sheets.
The grade for your Laboratory Report will be based on the following:
- Cover page attached and complete.
- Tables Ia, IIa, Ib, IIb complete and organized/labelled properly.
- Sample Calculations.
- Four Graphs: V vs. s and E vs. s for each electrode pair, organized and labelled properly.
- Two sketches/diagrams, one for each electrode pair, showing the relationship between the equipotentials and the lines of E.
- Discussion and conclusions, speaking to the issues raised in the instructions.
- Photos of the conducting paper used for the electrode pairs.
Back to PH 1121 Labs
Back to Main Page


