Geometry
- the Pythagorean Theorem
- Circles
- Straight Lines
slope
point-slope and slope-intercept forms
- Parabolas
- Other Conic Sections – ellipses,
hyperbolas
1. The
Pythagorean Theorem
Perhaps the single most significant theorem covered by secondary math courses is the Pythagorean Theorem. It is the basis for much analytic geometry, force diagrams in Physics and Civil Engineering, and Number Theory in Mathematics.
It applies only to right triangles and says that if the legs have lengths a and b, and the hypotenuse c, then c2 = a2 + b2.
Examples of triangles exhibiting the theorem are

These triangles have integers as sides; most do not but the algebra is all the same.
The negation of the Pythagorean Theorem is also of interest: if c2 ≠ a2 + b2.
then the triangle is not a right triangle.
Problem Set 1:
in each case below, the three sides of a triangle are given. Decide which ones are right triangles.
1. 6,8,12
2. 5,10,12
3. 8,15,17
4. 8,6, 10
5. 1, √3 , 2
follow this link
to solutions to Problem Set 1
A repeatedly useful skill is “completing a right triangle”. This means that if you are given only 2 sides, you can find the third side.
For example, if the hypotenuse is 7 and one leg is 5, what is the other leg?
solution: letting x denote the length of the unknown leg, we must have that
52 + x2 = 72 or 25 + x2 = 49 so x2 = 24
and x = ![]()
Distance and the Pythagorean Theorem:
If we use coordinate axes then the theorem can be used to find the distance between two points. The key reason behind this is that the axes are perpendicular to each other. Suppose we want to find the distance from the point (1,1) to (7,9). Plotted these look like:
and distance translates into the length of the green , sloped line. We can base a right triangle on this situation:
T
The length of the horizontal, red line is 6 since we go from
(1,1) to (7,1). The length of the vertical, red line is 8 since we then go from (7,1)
to (7,9). Thus we have a right triangle with legs of 6 and 8 and hypotenuse being the number we want. By the Pythagorean
Theorem, its length is the square root of
62 + 82
or ![]() which is 10.
which is 10.
This can be easily generalized to provide a formula for the distance between any two points. Suppose one point is (x1,y1) and the other is (x2,y2). A diagram might look like
The hypotenuse is the distance, d, that we are after. The horizontal leg is the amount x changes by in going from the first point to the second and the vertical leg is the change in y. Thus by the Pythagorean Theorem
(x2 – x1)2 + (y2 – y1)2 = d2
or, equivalently,
![]()
This is sometimes called the distance formula but it is really just the Pythagorean Theorem adapted to a particular situation.
Example: how far apart are (1, 3 ) and (13, 8) ?
Solution: by the above discussion, the distance is

Comments:
1) these are “textbook” problems designed to have “nice” answers. In reality, most answers will have a square root in them.
2) It does not matter which point you treat as the first one and which as the second one. If you exchange them you will pick up a minus sign inside the parentheses but once it is squared, it vanishes.
3) If the points have any negative coordinates in them, you must be careful not to make any sign errors. Parentheses are good ! Don’t skip steps. See below.
Example 2: How far apart are (-2,-5) and ( 7,-1)?
Solution:

Problem Set #2
1. Determine how far apart each
pair of points are:
a) (5,7)
and (8,11)
b) (4,-1)
and
(8,2)
c) (1,9)
and
(6,21)
d) (-5, 9)
and
(3,15)
e) (3,-9)
and
(23,12)
2. Find the
point halfway in between (4,1)
and (12,7)
3. What are 6 points that are all 5 units away from the point (3,4)
? Your choice!!
Follow this link to solutions to Problem
Set #2
Straight Lines
Slope
If we have two points in the x-y plane on a line and we compute the ratio of the vertical change to horizontal change it is called the slope of the line. It provides a measure of how steep the line goes up (or down).
If the points are (2,1)
and (5,7) then the line through them has slope (7 – 1)/(5-2) = 2.
This can be interpreted in the following way: for every unit you move to the right, you will go up two units. If you move 5 units to the right, you will go up 10 units. If you move 3 units to the left, you will go down 6 units.
If, as one goes from the left point to the right point, you go down, or the change in y is negative, then the slope is negative. The main thing to remember is that negative slope corresponds to a line going downhill (from left to right!).
For example, if we have the line through (1,4) and (4,3) then the slope computes to

with a graph of the situation as:
Slope-Intercept Form
Now you have an understanding of slope, you need to be able to generate equations of straight lines, for all kinds of reasons in future courses. There are two basic forms, with Slope-Intercept being the more commonly known. Given two points, you want to able to generate an equation for the line through them of the form
y = mx + b
where m is the slope and b the “y intercept”.
Example: a line passes through the points (2,1) and (6, 9). What is the slope intercept form of its equation?
Solution: the slope is computed, as earlier, to be m = +2. So we know that y = 2x + b at this point. Now we substitute either point in to find b. Picking x=2, y=1, we must find b so that
1 = 2(2) + b or b = -3.
Thus the equation is
y = 2x -3
and looks like
One way you can read this equation is as follows: you begin at (0, -3) on the y axis and then go up 2 units for every unit you go to the right (or down by 2 for every unit you go to the left).
Point Slope Form
If you are given the slope and one point the line goes through, you can directly and quickly put it into “point-slope” form. In general, this is

and left in this form. The previous example would leave us with
 or, equally correct
you can use either point and things work out just fine!
Problem
Set #3
Part One
Develop the equation of the
straight line meeting the given conditions and put it into slope-intercept
form (y = mx + b)
- it passes through (2,-1) and (-4,17)
- it satisfies 8x + 4y + 9 = 0
- it has a slope of -2 and passes through (2,4)
- it is perpendicular to 3x + 9y = 12 and passes through (1,4)
- it is horizontal and passes through (2,-3)
- it goes through (3,2), (5,8) and (9,20)
- it increases at a 45 degree angle to the positive x axis and passes through (4,0)
- it
is tangent to the circle x2
+ y2 = 25 at the
point

- it goes down 6 units for every 3 units it goes to the right and passes through (3,1)
- it has a slope of -2 and passes through the point (4,1)
Part Two – graphs involving straight lines – sketch each carefully and neatly
- The point (2, 1 ) is on the parabola y=x2/4 The tangent line to the parabola at that point has slope of 1. Sketch both the parabola and the tangent line and write down the equation of the line as well.
- Sketch
the line and circle from Part One,
#8
- The parabola y = -x2 + 9 has a tangent line with slope of -2 at the place where x = 1. Sketch both the parabola and tangent line
- Sketch the line whose equation is 3x + 9y = 24 by finding its x and y intercepts first.
Follow this link
for solutions to Problem Set #3
Circles
Having developed the capability to measure distance analytically, the next obvious thing is to look at circles. Recall the definition of a circle:
A circle is all points the same distance from a fixed point (center). That distance is called the radius.
Let (x0, y0) be the center , (x,y) be an arbitrary point on the circle, and r be the radius. Then the distance formula becomes
![]()
If we square both sides then this becomes the more often seen version
![]()
Example: determine the equation of the circle of radius 5 centered at (4,-1)
Solution:
![]()
or
![]()
Now what are the
coordinates of the points at the top, bottom, left and right of the circle?
solution:
beginning at (4,-1) we move 5 unit in the appropriate direction, so
(4, -1+5) = (4,4) at the top
(4, -1 -5) = (4,-6) at the bottom
(4 -5, -1) = (-1,-1) at the left
(4 + 5, -1) = (9,-1) at the right.
three of these points appear on the circle as:
Tangent Lines to
Circles
Calculus I is the study of derivatives and tangent lines. The circle is the first instance of a place where we run into tangent lines. The following graph shows one:
The red line is the tangent line to the circle at the point P. This means all of the following:
- it touches the circle once, not
crossing it (the notion of tangency)
- it is perpendicular to the radial
(dotted) line
- it’s slope is the negative reciprocal
of the slope of the radial line
Example: for
the circle centered at the origin of radius 10,
a)
confirm that
the point (6,8) is on the circle
b)
determine
the equation of the tangent line to the circle at (6,8)
Solution:
a)
![]() so the point (6,8)
is 10 units from the center putting it on
the circle
so the point (6,8)
is 10 units from the center putting it on
the circle
b) the slope of the line from (0,0) to (6,8) is m=8/6 = 4/3. The line passes through (6,8) so if
y = (-3/4)x + b for the line perpendicular to this
then b is
picked to satisfy 8 = (-3/4)(6) + b or b = 8 + 9/2
= 25/2
and the equation of the tangent line is y = (-3/4)x + 25/2.
Determining
the Circle from the Equation.
This is the reverse of what we did in the last section. We are given the equation of the circle and wish to know its circle and radius. It takes some algebra to do this.
Example: a circle has the equation
x2 + 2x + y2 + 10x = 10
Where is it’s center and what is it’s radius?
Solution:
we use the algebraic technique of “completing the square” by adding both 1 and 25 to both sides as follows:
x2 + 2x + 1+ y2 + 10y + 25 = 10+1+25
Since we added the same thing to both sides, the equation is still valid. But why?
The 1 makes a perfect square of the first three terms while the 25 makes a perfect square of the last three:
(x+1)2
+ (y+5)2 = 36
(the reader is urged to expand (x+1)2 as well as (y+5)2 and check all this ). So the center is at (-1, -5) and the radius is 6.
Why 1 and 25??
Here is the rule
for completing a square of x2 + bx
a)
compute half of b
b)
square it
c)
add your result from the previous step to both sides of the equation
d)
form (x + b/2)2
Example: determine the center and radius of the circle whose equation is
x2 + 6x + y2 -8y = -9
Solution:
we add both 32 and (-4)2 to both sides:
x2 + 6x + 9
+ y2 - 8y + 16 = -9 + 9 + 16
(x+3)2 +
(y-4)2 = 16
so the circle has its center at (-3,4)
and radius of 4 (not 16…)
Problem Describe the circle whose equation is x2 + y2 + 8y = 0.
Solution: we only need to complete the square on y, by adding 16 to both sides:
x2 + y2 + 8y + 16 = 0 + 16.
or x2 + (y + 4)2 = 42. This means it has the center at (0, -4) and radius of 4. The graph, while we are at it ,looks like
Problem
Set #4
- What is the equation of a circle with the following properties:
a) center at (5,7) and radius of 7
b) center at (-2,3) and radius of 9
2. What is the center and radius of the circle described by each equation below?
a.
x2 -8x +16 + y2
=25
b. x2 + 2x + 1 + y2 – 6y
+ 9 = 49
3. What is the center and radius of the circle described by each equation below?
a) x2 -10x + y2 +4y = 7
b) x2 + y2 -8y = 33
c) x2 -18x + y2
-2y + 81 = 0
d)
x2 + 10x + y2 -14y = 7
Follow this link
for solutions to Problem Set #4
Parabolas
A parabola has a definition that is very similar to that of a circle: all points equidistant from a point and a line. (as compared to all points equidistant from one point – the center – for a circle).
A picture might clarify this:
Here, the point P(x,y) is a representative point on the parabola and is the same distance from the point Q on the straight line and the Focus. The red line then suggests all such points and is the parabola. The blue line is called the directrix. The lowest point on the parabola is called the vertex.
If we put the Focus at the point on the y axis (0,d) and the directrix at y = -d then, with a little algebra, the equation of a parabola in standard form comes out:
![]()
while if the vertex is at some other point (x0,y0) then the equation becomes
![]()
Finally, if the parabola opens downward instead of up then there is a minus sign:
If we add in the x-y Cartesian Coordinate system, things may look more familiar:
In this example, the focus is 4 units above the origin and the directrix is 4 units below it so d = 4 here and the equation is
![]()
If we move the Focus closer (smaller d value) to the directrix, the parabola adjusts accordingly. Taking d = 2 produces a more cupped graph such as:
whose equation is therefore
![]()
If the vertex is somewhere other than the origin, then all measurements are taken relative to it (for example, the distances to the focus and directrix) and the equation becomes:
![]()
We refer to this as the Standard Form of a parabola. As an example, the equation
![]()
means that the vertex is now at (7,3) , the parabola opens up , the d value is 2 and therefore that the Focus is at (7,5) while the directrix is the line y = 1 . The graph would then look like

For parabolas or ellipses not centered at the origin, to get them into Standard Form, you may wish to review the algebraic technique of “Completing the Square”. If you do, please follow this link for tutorial materials.
Problem
Set #5
1. In each case below, construct the equation of the parabola having the specified characteristics. Also indicate where the vertex is if it was not specified.
a) Focus at (0,5) and directrix the line y= -5
b) Focus at (0,2) and directrix the line y = -2
c) Focus at (0,4) and directrix y=0 (the x axis)
d) Focus at ( 3,4) and directrix y = -4
e) Focus at (3,9) and directrix the line y = +1
f) Vertex at (2,10) and directrix 3 units below it
g) Vertex at (-3,5) and directrix 7 units above it
2. Based on each equation below, decide
where the vertex is
where the focus is
where the directrix is
whether the parabola opens up or down
a)
20y = x2
b) y = -x2/12
c) y + 3 = (x – 9)2/4
e)
y -4 = -(x + 1)2/36
3. Use algebraic methods on each equation to put it into “standard form”. Once there, identify where the vertex is and whether the parabola opens up or down.
a)
x2
-8x - 16y = 0
b)
x2 -32y +
64 = 0
c)
x2 +
16x - y + 6 = 0
d)
x2 -10x
+ 32y = 7
Follow this link to see solutions to Set
5.
The
Reflective Property of Parabolas
No discussion of parabolas would be complete without including the one key property of them that makes them useful in everyday life: their reflective property. Here we will show what this amounts to and how it is applied.
First we begin with a parabola with vertex at the origin and focus at (0,4).
Now suppose the parabola is a satellite dish and a signal comes from a satellite along the red line . The red line is parallel to the y-axis. What will happen, then , is that the reflected signal off of the parabola will always proceed to go through the Focus. No matter where on the parabola it strikes, as long as the dish is pointed so the y axis is parallel to incoming signals. Thus one would put a small receiver at the Focus and pick up all incoming signals.
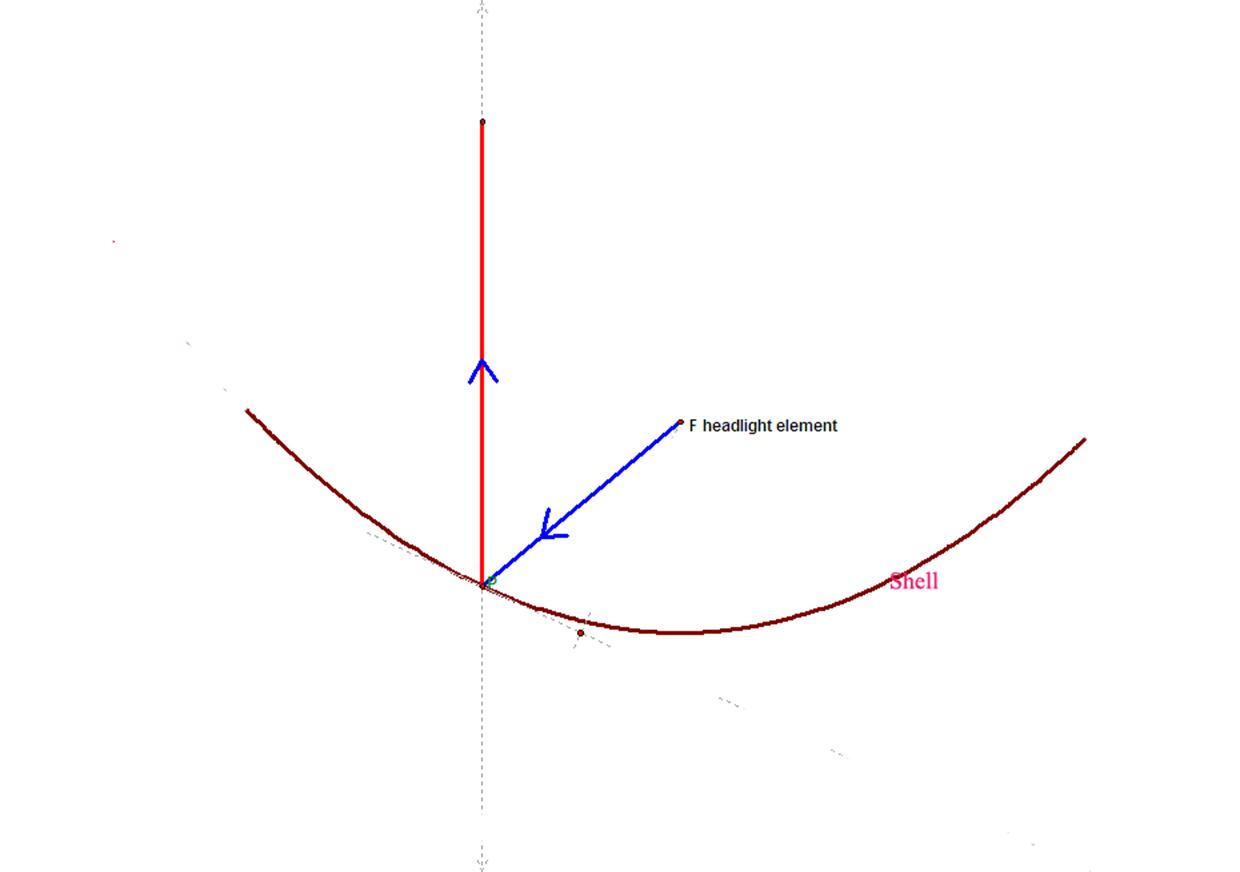
Next suppose we have the headlight in a car. It really has two components: the headlight element that emits light in a 360° pattern, and the shell of the light which is reflective. The shell is shaped as a parabola; the element is placed at the Focus. Any light coming from the element which strikes the shell will then be reflected off of it and always go straight ahead parallel to the y-axis, presumably in the direction the car is going.
![]()
![]()
![]()
![]()
![]()
![]()
Parabolas and Quadratic Equations
In any section on algebra, especially the part on factoring, there will be discussion and demonstrations involving the “quadratic equation”. Essentially this says that if you are trying to solve
ax2 + bx + c = 0
then the solutions are given by
![]()
but that there are no solutions if the quantity under the radical, b2 -4ac, is less than 0. Usually that’s pretty much it, with not a lot of understanding resulting, just skills.
So… suppose we have the parabola y = ax2 + bx + c and we want to know where it crosses the x axis. We know that the sign of a determines if the parabola opens up or down and the combination of all coefficients determines where the vertex is (see Problem Set #5 ).
For example, if we have y = x2 -4x -32 then we know it opens up. With some algebra we can show the vertex is at the point (2,-36). Since the vertex is well under the x axis and the parabola opens up, it is clear it will cross the x-axis twice as it graph reveals:
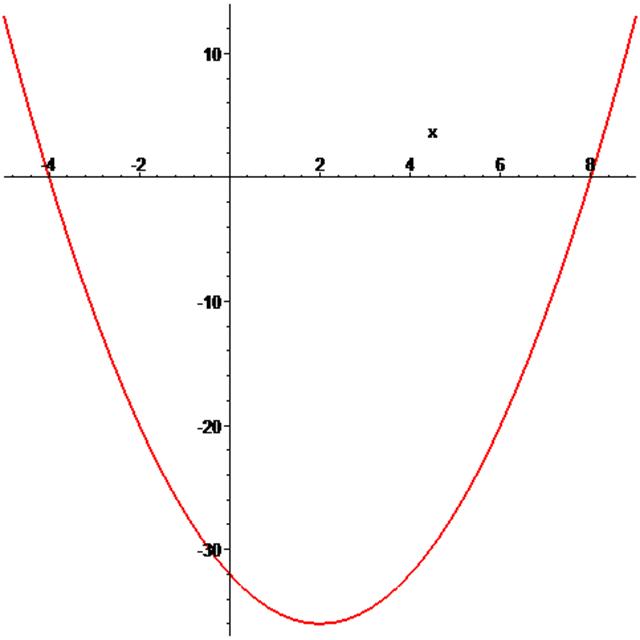
Further it looks pretty clear that the graph crosses at x = -4 and x = +8. What does the quadratic equation say? It says the solutions are given by

so the two approaches, graphical and algebraic, seem to be in agreement. In other words the problem of finding solutions to
ax2 + bx + c = 0
is equivalent to finding the x intercepts of the parabola
y = ax2 + bx + c.
Now we know the vertex could be anywhere – above, on , or below the x-axis. Graphically three examples might look like
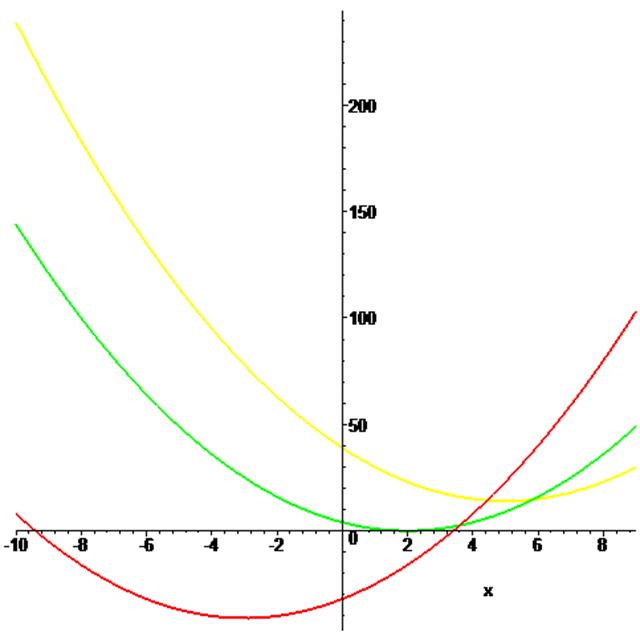
where the red curve is
y = x2 + 6x -32 the green curve is y =x2 -4x + 4 and the yellow curve is y = (x-5)2 + 14.
Using the quadratic equation for each one, in order, says solutions are:
![]() or x =
3.403 and -9.403 (two
intercepts)
or x =
3.403 and -9.403 (two
intercepts)
 (double
root)
(double
root)
 or
or ![]() showing there is no real solution due to the square root
of a negative number.
showing there is no real solution due to the square root
of a negative number.
Problem Set #6
Here we wish to put everything together covered so far. For each equation listed,
a) put it in Standard Form for a parabola
b) identify its vertex
c) decide if it opens up or down
d) find the value for d and determine where it’s Focus is
e) use algebra to find where it intersects the x axis or show that it does not
f)
sketch it by hand, incorporating all of the
information found in parts a) – e)
1. 32y + (x-4)2 = 64
2. 8y + x2 = -16
3. y -x2 -8x = 0
4. 16 y + x2 -20x -4 = 0
5. y = x2 +14x + 40
6. y = x2 - 25
Follow this link
for solutions to Problem Set #6
Ellipses
We recall that the equation of a circle centered at the origin with radius R is x2 + y2 = R2 and is saying, by way of the Pythagorean Theorem, that we have all points a distance R from the origin.
The simple approach of intersection points gets us a graph. By setting y=0 we find it crosses the x axis at (+/-R,0) If we set x=0 then we find it intersects the y axis at (0, +/-R). This pretty much determines the graph, and with little effort:

If we divide both sides by R then we get an equivalent version
![]()
Let’s make the constant R we are dividing by different in each term:
![]()
Once again we can get a good estimate of a graph by finding the points of intersection, as before by setting x and then y equal to 0.
A little algebra and we find the points of intersection to be at (+/-a,0) and (0, +/-b). This results in a graph like
It looks like a circle except no longer round. In fact it is referred to as being eccentric – out of round. Mechanical engineers will think of a camshaft. A computer scientist might think of a circle viewed at an angle – such as when you are walking down the street and look at a manhole that you are approaching. A mathematician thinks of a slice of a cone at an angle to the axis of the cone – a conic section.

(this image comes from Wikipedia at http://en.wikipedia.org/wiki/Image:Conic_sections_3.png.
In the ellipse shown above the cone, the longer (horizontal) radius of it is called the major axis (and is
a units long) while the vertical radius is called the minor
axis (and is b units long). If a=
b we have a circle, The more a and b are different the more eccentric the circle is.
Like the parabola, the ellipse has a focus (actually two
of them) as well as a reflection
property. The sketch below shows
both:
A ray going through one focus will bounce off of the ellipse and go through
the other focus. This property is used
in reflective telescopes including the Hubble.
Summary of details
about ellipses:
the equation
of an ellipse centered at (x0,y0) in Standard Form is
![]()
the area is πab (compare to circles and πR2 )
the Foci are located at (+/-c , 0) where c2
= a2 – b2
if you move the foci closer and closer together then a=b and you have a circle
and the two foci are at the center
the sum of the lengths of
the L1 and L2 is constant
(and an ellipse
can be drawn with string using this as a circle can. An animation of this can
be found at http://mathworld.wolfram.com/Ellipse.html
)
the eccentricity is defined as
![]()
for a circle a=b so the eccentricity is 0.
The greater e is, the more
“out of round” the ellipse is.
Problem Set #7 Ellipses
1.
Sketch
each ellipse by the method of intercepts
a) 4x2 + 9y2 = 36
b) x2/25 + y2/49 = 1
c) x2/81 + y2 = 1
d) x2/64 + y2/64
= 1
2.
For
each ellipse in Problem 1, compute
its eccentricity and area
3.
For
each equation below, put it in standard form, identify its center and sketch it
a) x2 + 8x +
y2/4 +15 = 0
b) 4x2 -16x +
9y2 + 90y + 205
=0
c) x2 -6x +
y2 -12y = 36
Follow this link to see solutions to
Problem Set #7
Hyperbolas
The basic equation of a hyperbola centered at the origin is
![]()
This looks a lot like the one for the ellipse except for the minus
sign. That little detail has substantial
effect on the graphics that are associated.
Suppose for sake of simplicity we examine
x2 - y2 = 1. As in
the case of the ellipse we learn something by looking at intercepts. Let’s
begin by setting y=0 and getting the x-intercept. We have
x2 - 02 = 1
or x = ±1 so the intercepts are
at (1,0) and (-1,0).
Now let’s look on the y axis by setting x = 0. This results
in 02 - y2 = 1
or y2 = -1.
This equation cannot be satisfied with real numbers; there are no
y intercepts for this hyperbola.
Let’s solve for y in terms of x and
think about how a plot might then work out.
We have
x2 - y2
= 1
y2 = x2 - 1
or finally
![]()
Now examine that last expression algebraically. We cannot take square roots of negative numbers so we must have x ≥ 1 or x ≤ -1. In other words x cannot be in between -1 and + 1. There is no graph there.
Next if x > 1 then as x increases, y also increases. For x really big, x2 – 1 is about the same as x2 and thus
![]()
In other words, the hyperbola becomes the straight line y = x. This is called an asymptote. This is all show by the actual graph
Using the same
type of thinking in general, if we go
back to
![]()
and solve for the x intercepts we get (a,0) and (-a,0). Solving for y in terms of x we get
![]()
or
![]()
or
![]()
and we see that x cannot be
between -a and + a or square roots of negative numbers occur. Further, using the same argument as
before, if x is relatively large then
![]()
and so y ≈ +/- ![]()
That is, for x large, y is close to the straight
lines y =
![]() and y = -
and y = -![]() . These are the
asymptotes of the hyperbola .
. These are the
asymptotes of the hyperbola .
Summary:
For a hyperbola with equation
![]()
· it is centered on the x axis and intersects it at (-a,0) and (+a, 0)
· it never crosses the y axis
· it has asymptotes of the straight lines y = bx/a and y= -bx/a.
Problem: Analyze and sketch the equation
![]()
Solution: it is centered on the x axis. It’s intercepts are at (3,0) and (-3, 0) The asymptotes are ![]() A hand sketch based
on this information might be:
A hand sketch based
on this information might be:
Problem
Set #8:
1-6: identify the intercepts and asymptotes for each equation below and then sketch
1. ![]()
2. ![]()
3. ![]()
4. ![]()
5. ![]()
6. ![]()
in 7-9, you must first put the equation into standard form with a little algebra, then find intercepts and asymptotes
7. x2 - y2 = 16
8. x2 - 9y2 = 49
9. 16x2 - 25y2 = 400
in 10 you must complete the square first to find the center; then proceed as before.
(challenging; optional)
10. 16x2 – 64x -9y2 + 54y
= 161
in 11-14 the roles of x and y are swapped due to signs. Use the same thinking as before and identify the intercepts (this time on the y axis) and the asymptotes; sketch
11. y2
– 9x2 = 81
12. 4y2 -
x2 = 36
13. y2 - x2 = 4
14. y2
= 100