Abstract
Graphical Abstract
What is it about?
At the beginning of the year, STEM 1 involves a five-month-long Independent Research Project. This engineering or research project can be on any topic. During this period, we engage in intensive research, design prototypes, conduct tests, and deliver public presentations. At the end, we present our project to judges and have the opportunity to qualify for various science fairs such as WRSEF, MSEF, and ISEF. We also focus heavily on technical writing. During class, we prepare and write grant proposals as well as a STEM Thesis that details our project. In the second half of the year, we form groups of four or five to work on the Assistive Technology Project. In this project, we design and engineer a mechanism that assists and benefits people in society. Throughout the course, students learn the importance of dedication, research, presentation, public speaking, and technical writing skills, which can be applied to future endeavors.
Overview
Professional and recreational runners exercising in densely polluted areas are exposed to excessive levels of air pollution. Existing mask models fail to balance breathability and comfort with filtration efficiency. This project aims to develop a mask that combines exceptional comfort with a high filtration rate, meeting the needs of active users.
Abstract
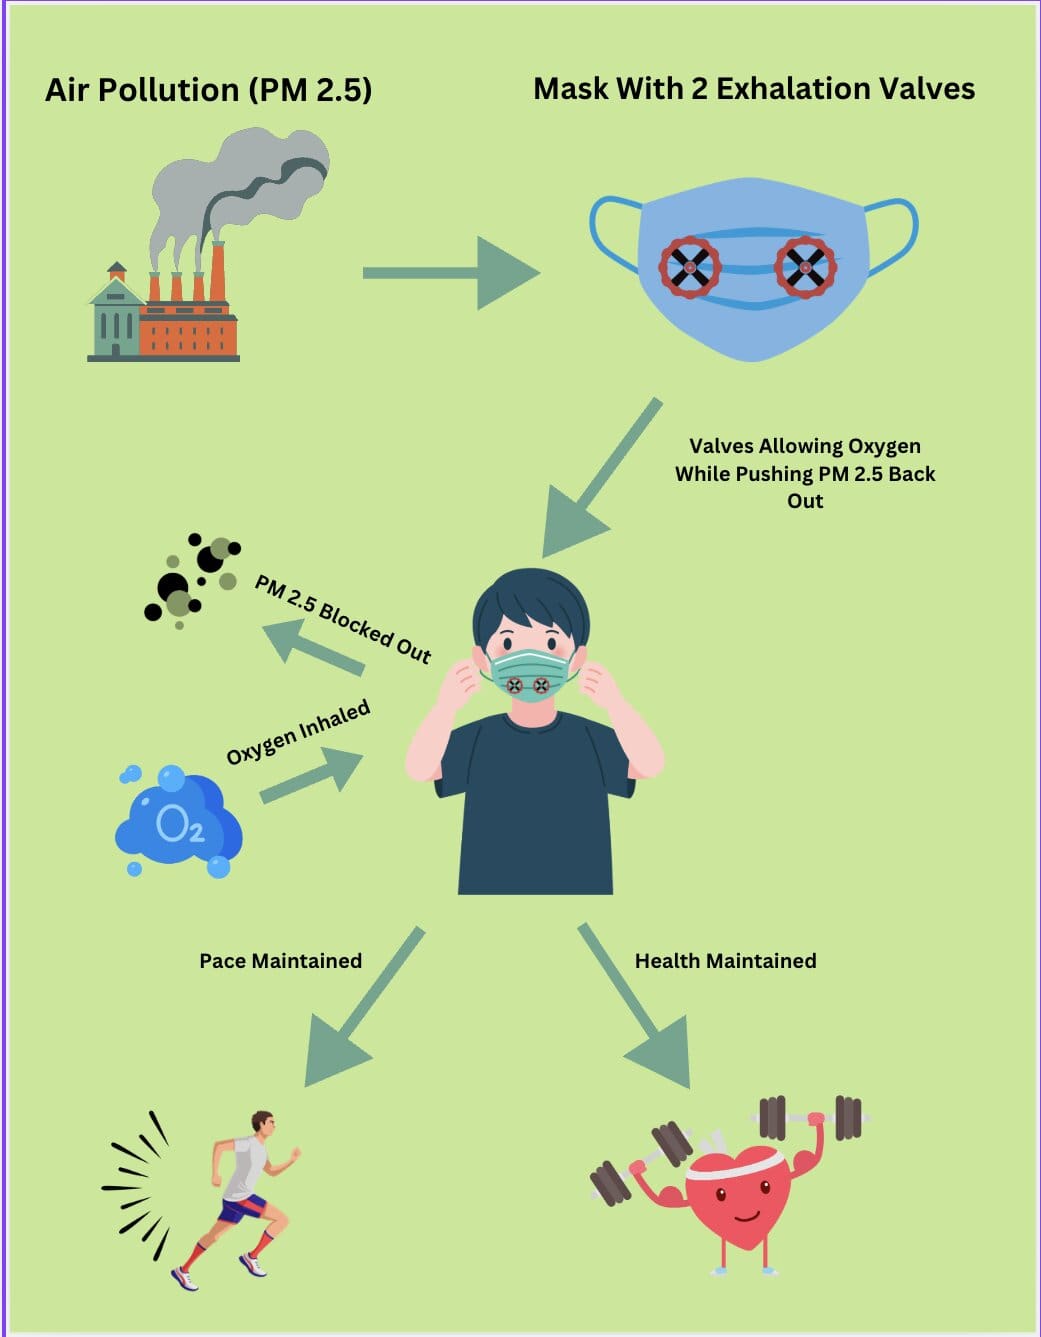
Graphical Abstract
Phrase 1
Professional and recreational runners inhale significant amounts of pollutants, particularly PM 2.5, during their activities. This not only hampers their performance by reducing breathability but also poses serious health risks, such as respiratory damage.
Phrase 2
Design a nanofiber-based mask with exhalation valve functionality that effectively filters out PM 2.5 while providing comfort and breathability for the runner.
Background Infographic
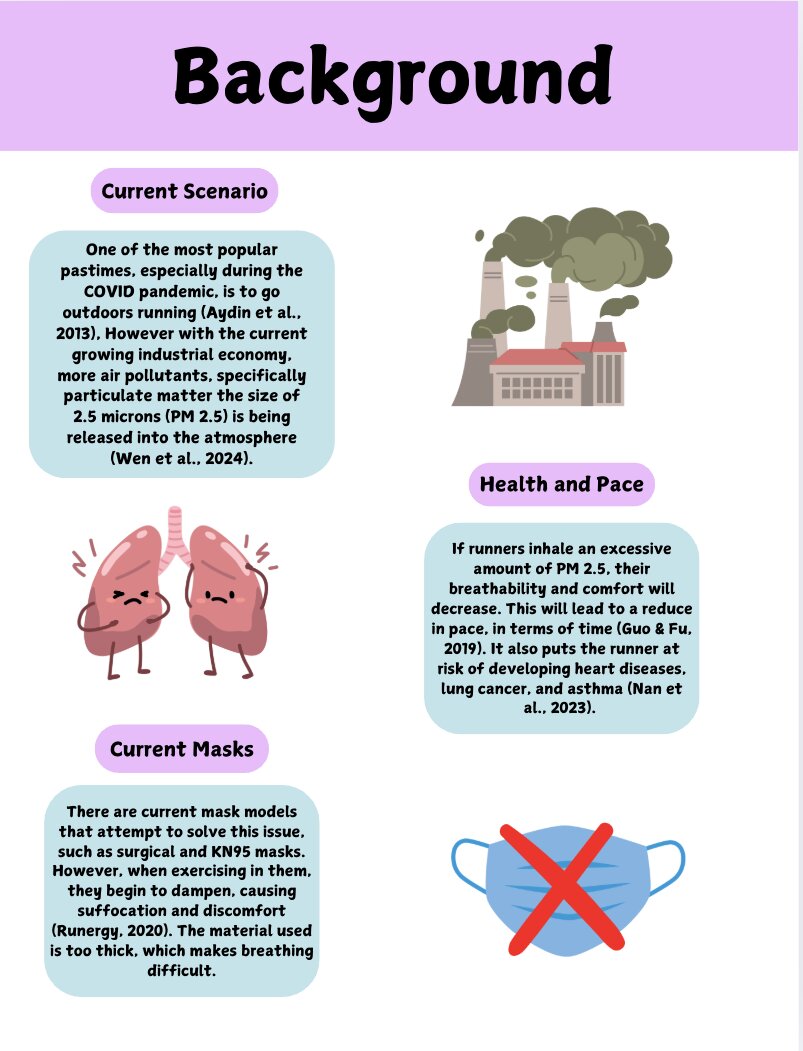
Background
Procedure Infographic
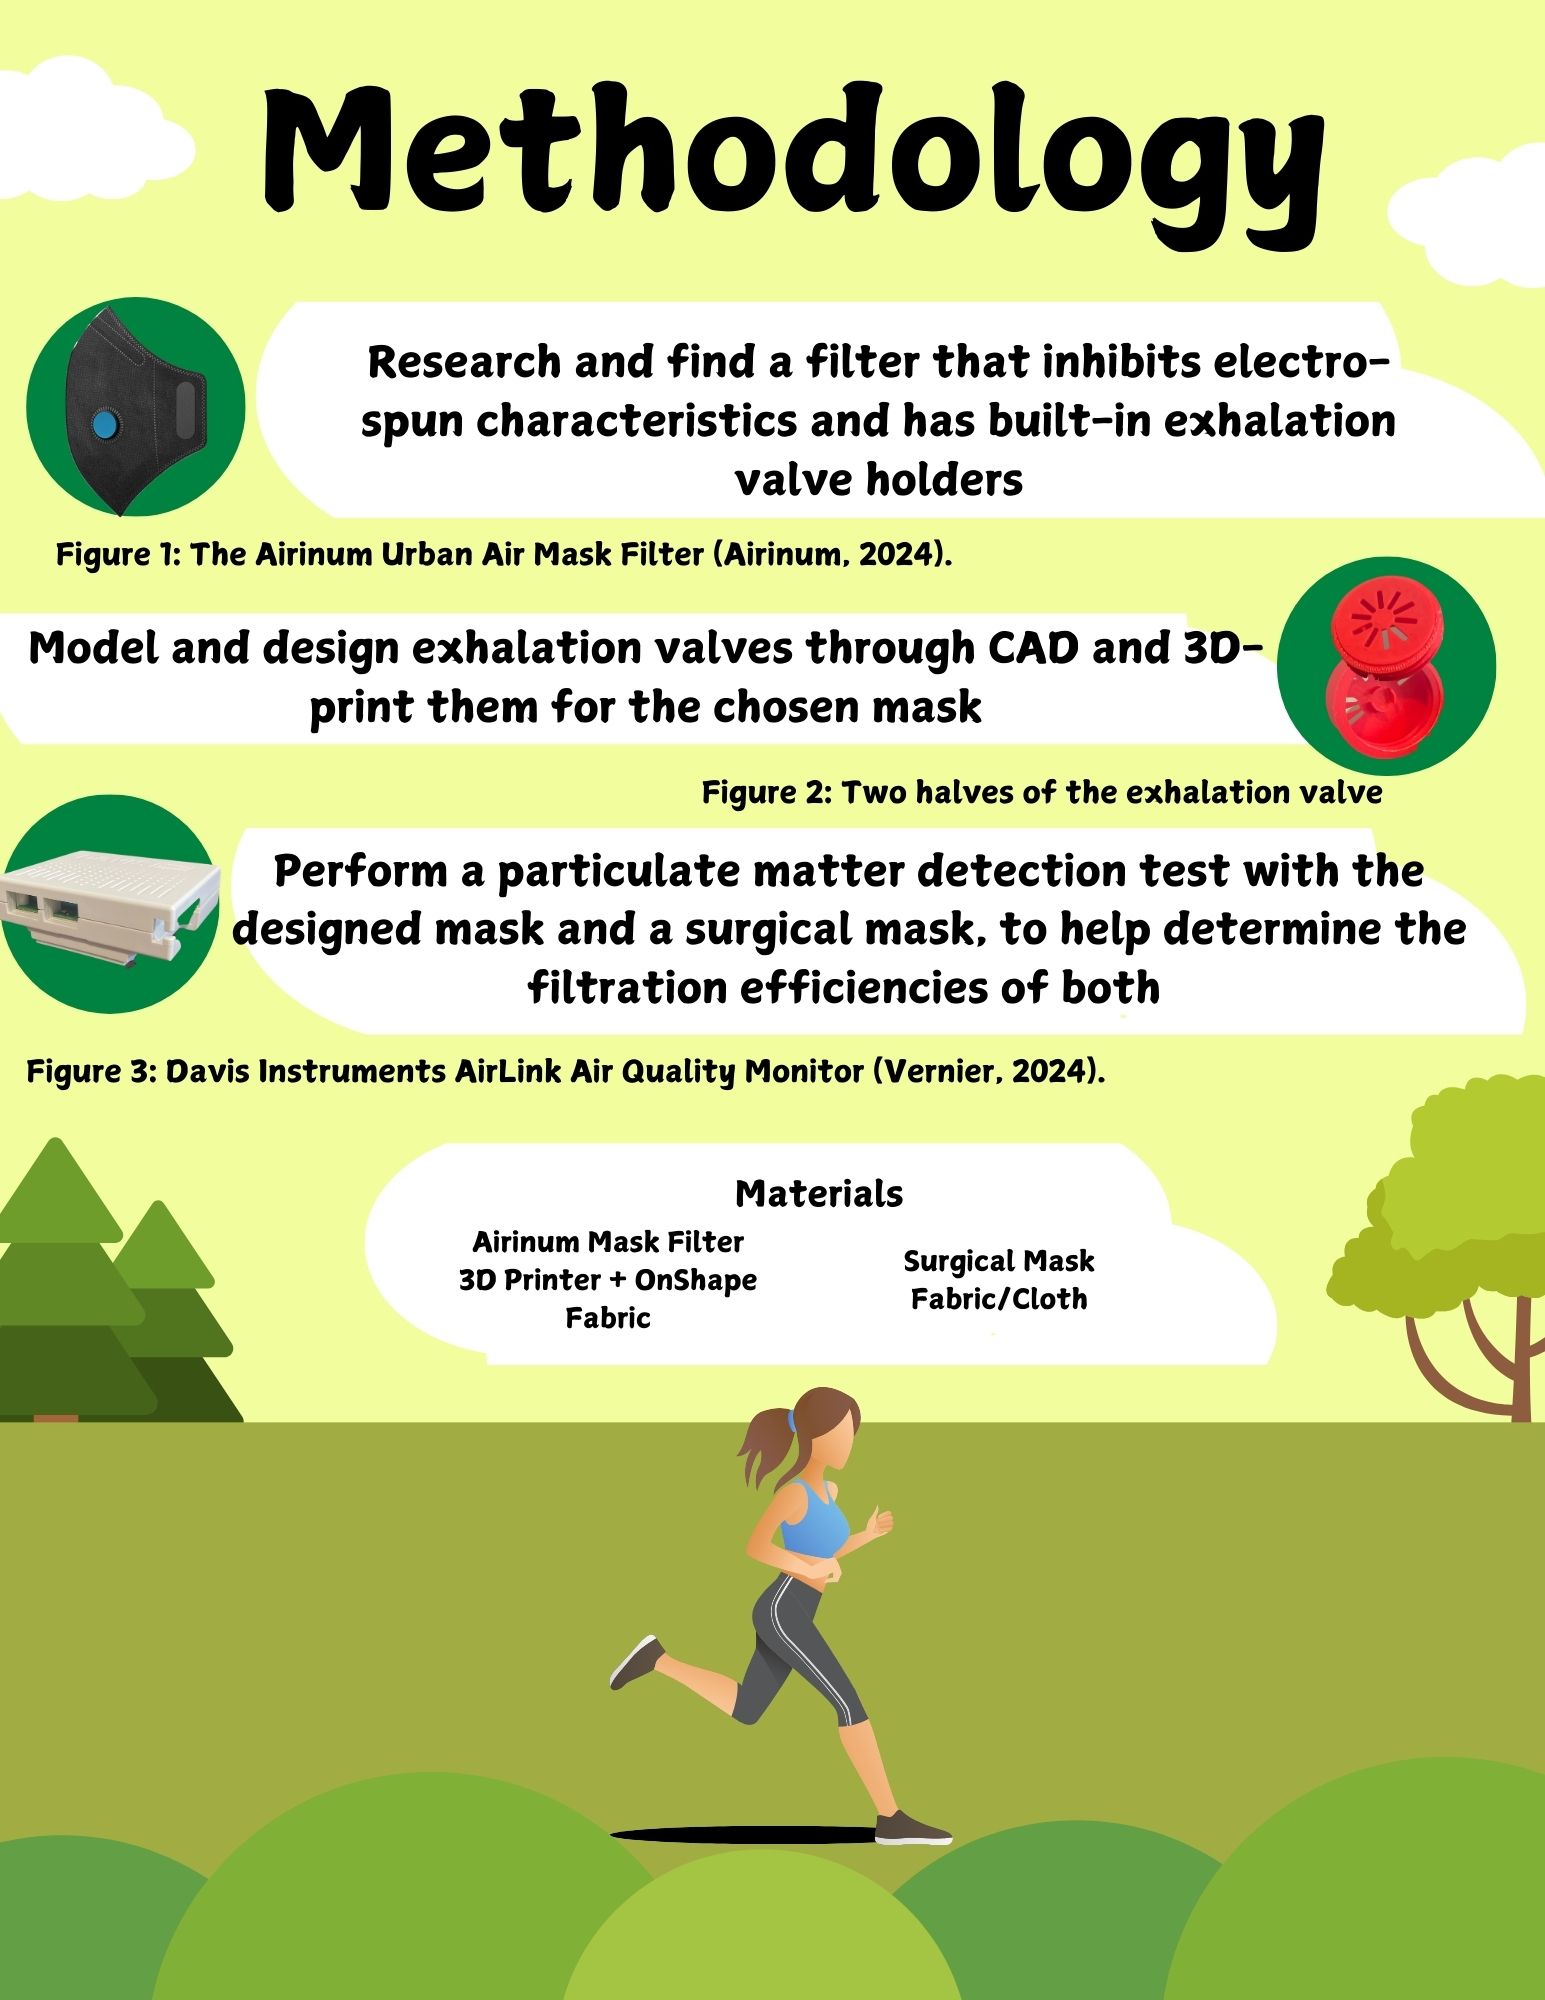
Procedure
Figure 1
A decision matrix with 3 different mask models and a competitor of a surgical mask
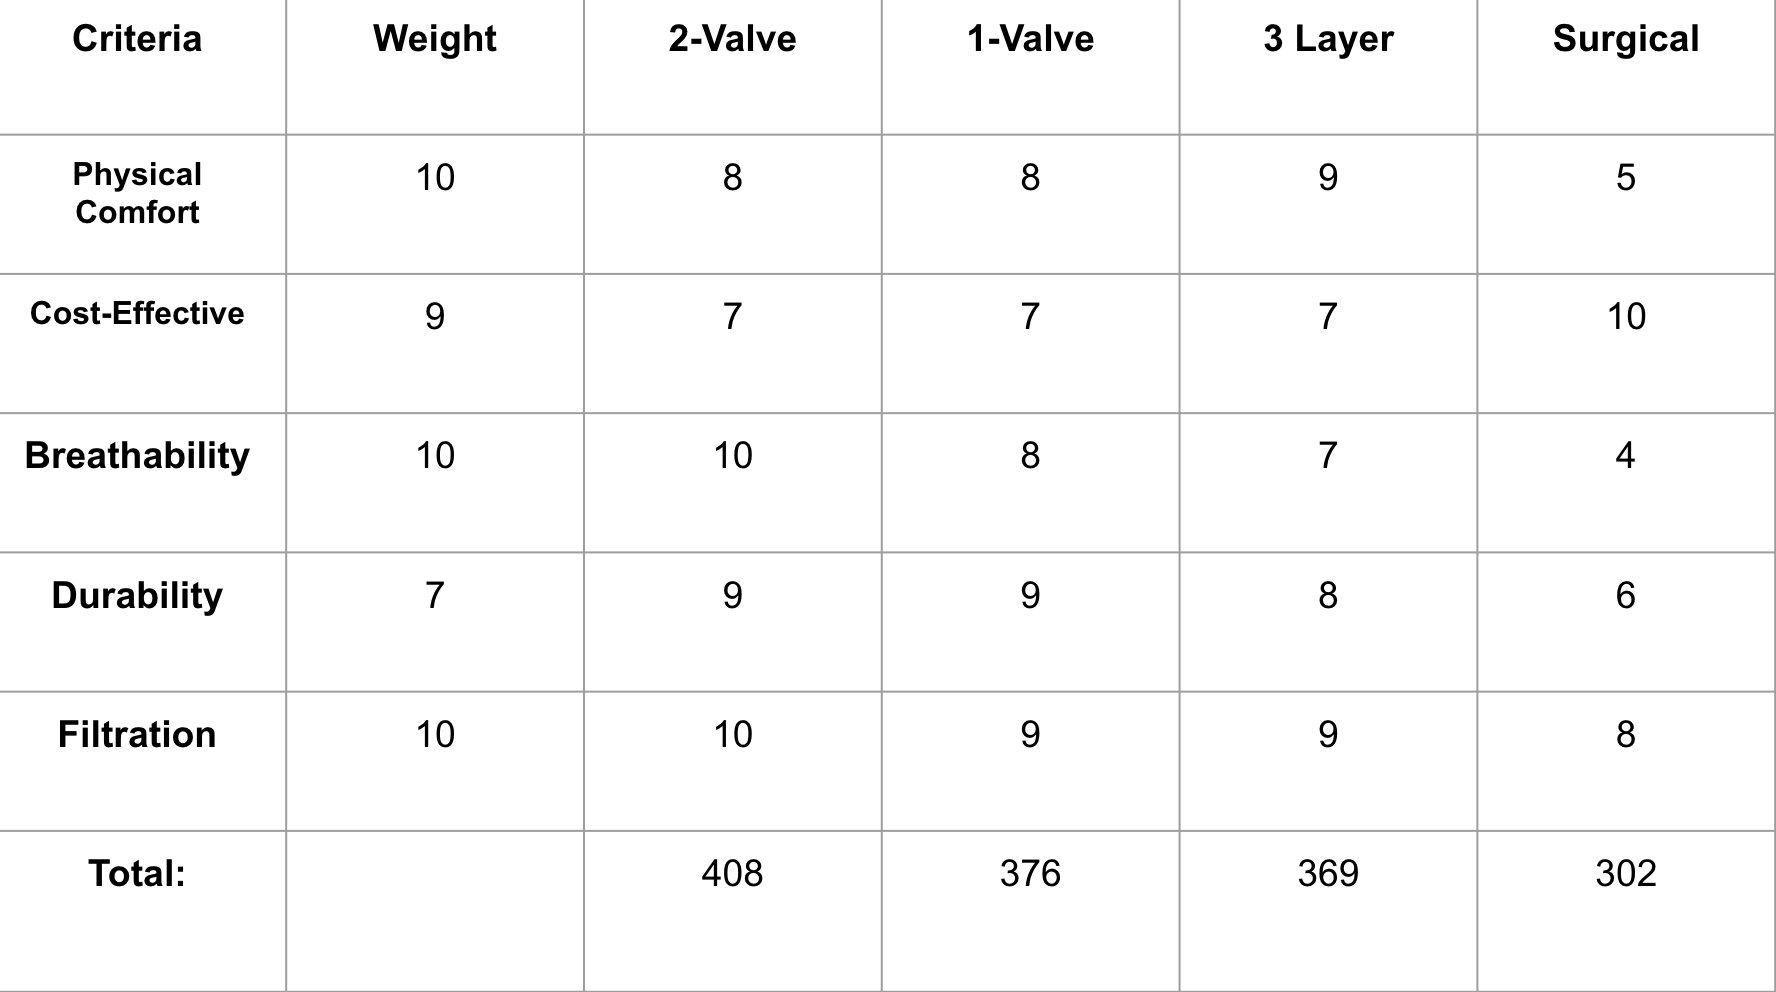
Figure 2
A table with the amount of particles for PM 1.0, 2.5, and 10.0 that penetrated through the mask each trial.
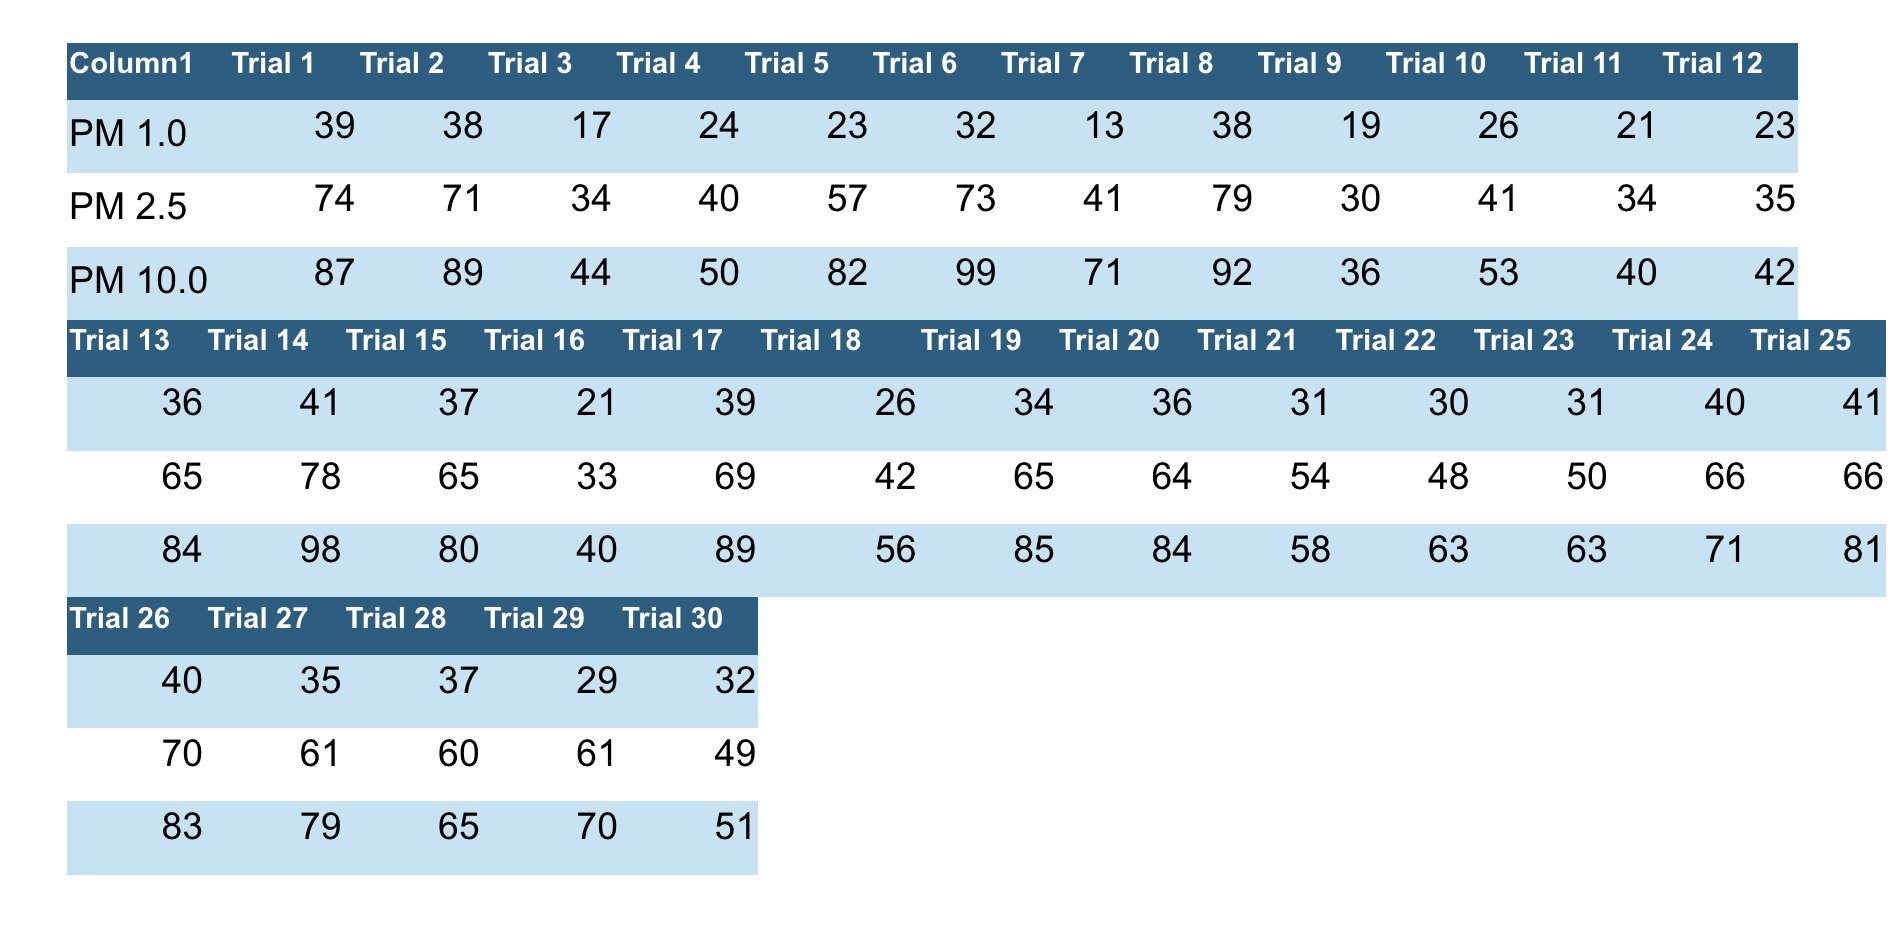
Figure 3
A graph of the amount of penetrated particles of PM 1.0, PM 2.5, and PM 10.0 throughout 30 trials
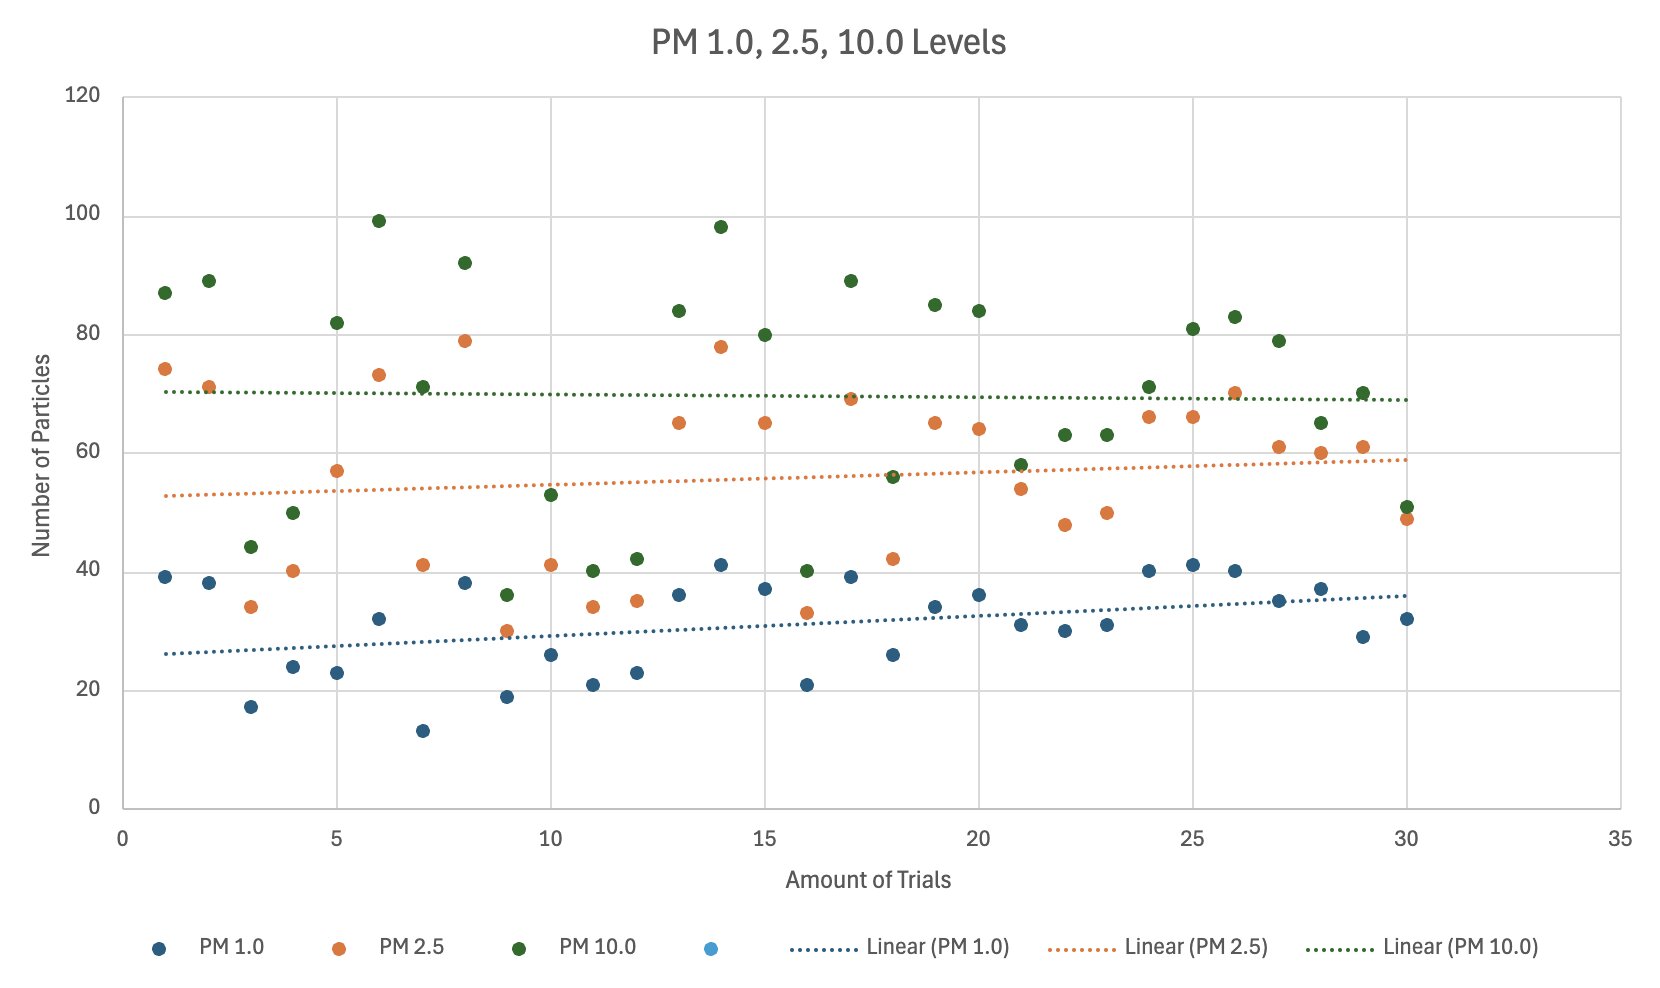
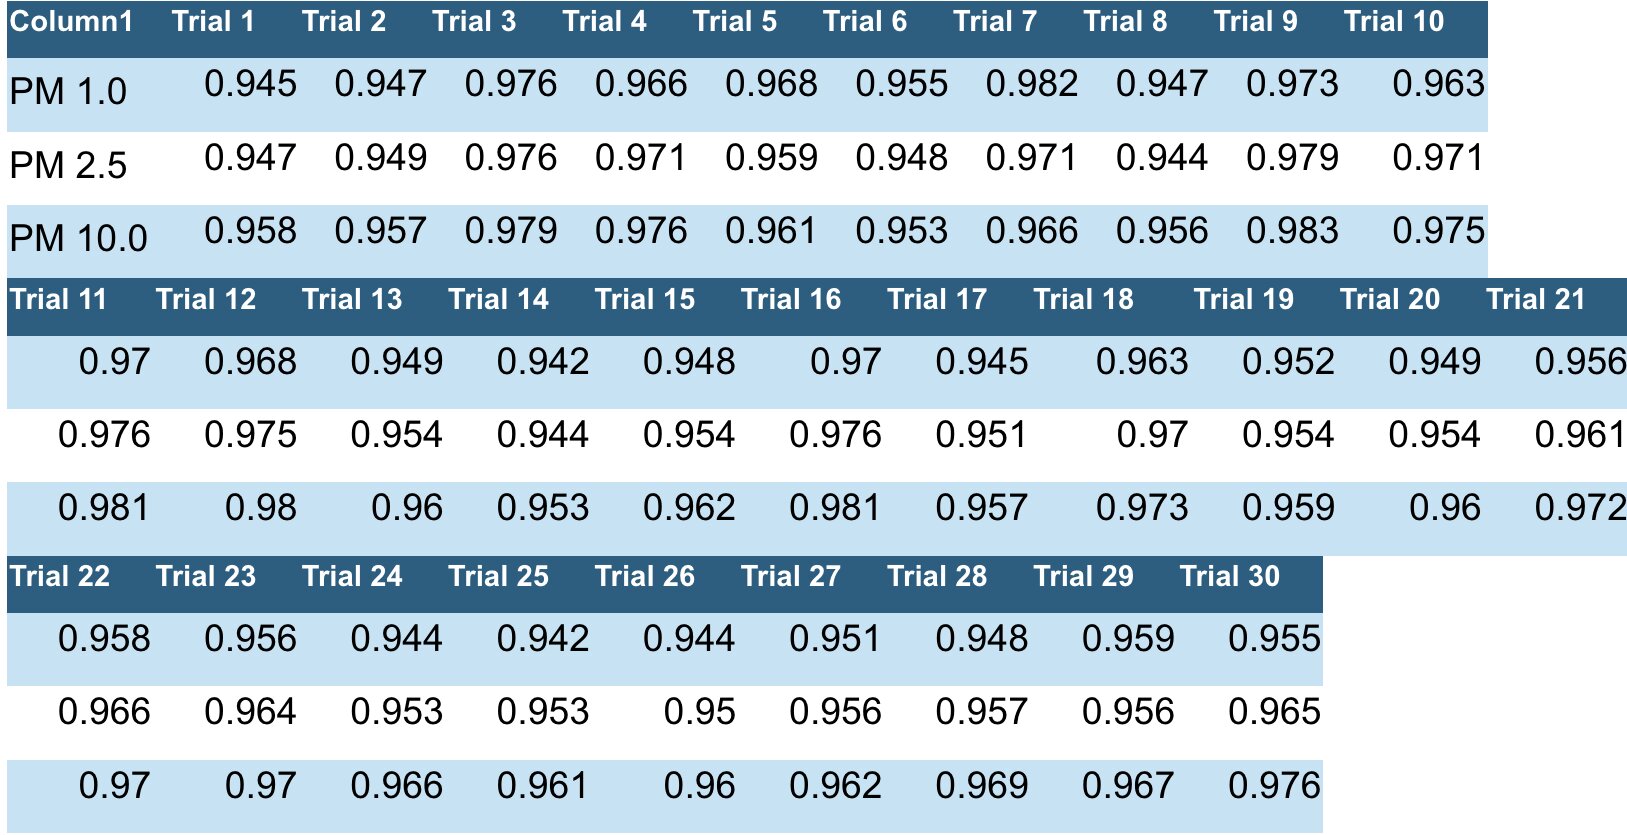
Figure 4
The filtration percentage (in decimal form) of the mask for each PM size over 30 trials
Analysis
Discussion and Conclusion
References
STEM Fair Poster