Free-Body
Diagrams
Part II, Equilibrium
•
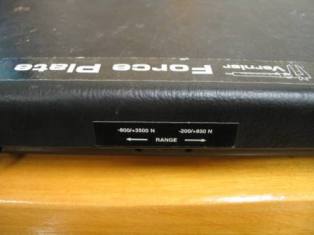
Before you do anything else, please check that the switch on one of the
sides of the force plate is properly set. It should be at the
setting marked

• Open today’s Logger Pro file. Place the force plate on the floor and zero the force value. Start collecting data. One student should slowly step onto the force plate, remain motionless for a few seconds, then step off. Both students may try.
• Then one student should step onto the plate, and the other student should zero the force. Acquire data while the student slowly picks up some masses or a book, then sets the object(s) down. You will probably have to use the Autoscale button to see the data well. Did the force on the plate go up or down while holding the object?
• Alternate students. For this step and future ones, zero the force again if necessary. Collect a curve while you start pushing down on the table, holding the force for a few seconds, then slowly releasing it. Copy and paste this plot into the box below Question 3 of the worksheet. Ask yourselves if the data are consistent with the free-body diagrams you made in response to Question 1.
-800/+3500
N.
The
switch is just below the word "Range."
• Open today’s Logger Pro file. Place the force plate on the floor and zero the force value. Start collecting data. One student should slowly step onto the force plate, remain motionless for a few seconds, then step off. Both students may try.
• Then one student should step onto the plate, and the other student should zero the force. Acquire data while the student slowly picks up some masses or a book, then sets the object(s) down. You will probably have to use the Autoscale button to see the data well. Did the force on the plate go up or down while holding the object?
• Alternate students. For this step and future ones, zero the force again if necessary. Collect a curve while you start pushing down on the table, holding the force for a few seconds, then slowly releasing it. Copy and paste this plot into the box below Question 3 of the worksheet. Ask yourselves if the data are consistent with the free-body diagrams you made in response to Question 1.
Feel free to try other variations on equilibrium (no acceleration) measurements before moving on to Part III.
Back to the Overview
Back to Part I
On to Part III
Worksheet
Index