ME 3901 – Laboratory Experiment
Strain Gage Analysis and Pressure Determination
INTRODUCTION:
The ASME boiler codes require
continuous monitoring of pressure in thin walled pressure vessels. A thin walled cylinder has a wall thickness
< r/10, with r being the radius of the cylinder. In this situation only the membrane stresses
are considered and the stresses are assumed to be constant throughout the wall
thickness, t.
Consider a thin-walled pressure vessel as shown in Fig. 1.

Figure 1: Thin wall cylinder schematic with cross
sectional
lines A---A and B---B
indicated.
The hoop stress can be determined from a stress analysis of the tank cross section, such as along line A--A of figure 1 and is shown in Fig. 2.[1]
![]() (1)
(1)

Figure 2: Cross section A--A showing that hoop wall
stress
must balance internal
pressure.
Similarly, figure 3
illuminates the analysis methodology for determining the longitudinal stress
(along cross section B---B of figure 1). ![]()
![]() (2)
(2)

Figure 3: Cross section B--B showing that axial wall stress
must
balance internal pressure.
Recall that the strain is
related to stress in this situation via:
eHoop = (sHoop - n sLong)/E (3)
which
can be rearranged for pressure by substituting Eqs. 1 and 2 into 3:
P = E t e /[ r (1 - n/2)] (4)
where
Poisson’s ratio n = 0.30 and elastic modulus E = 12.7 x 10⁶ psi for our test
pressure vessels. Consequently, a strain
gage mounted externally in the circumferential direction of the vessel can be
directly related to the pressure within the tank.
PROCEDURE:
Select
a soda can of your choice and label it with permanent marker on the top of the can.
Attach
a practice gage near the top or bottom rim.
(That is, keep the mid section of the soda can clear for the real strain
gage).
Solder
a short piece of the 3 lead wire to the practice gage and present to the
TA/Instructor
Several
soda cans have been cut open. Measure
(repeatedly) the wall thickness with a micrometer.
Similarly,
measure your can diameter near the mid-height of the can. Perform several measurements. The diameter can be measured with a vernier
caliper. These data (the average values)
will be used in the experiment. Save
your raw data in an Excel sheet for submission.
Mount a 120 ohm strain gage (R4) along the circumferential direction on the test pressure vessel (your soda can) while the soda can is unopened. The vessel surface needs to be prepared according to the specifications listed in the strain gage installation manual.[2] (In practice we have found that the soda cans are very clean and one can attach the strain gage to the can surface without further treatment.) Each student attaches a strain gage to their soda can.
Attach
lead wires to these strain gages (i.e. each partner does one can). The wire length should be approximately 1m. Solder the red wire to one strain gage tab and solder the black and white wires to the other strain gage tab. Test your final strain gage with an ohm meter and verify that you read approximately 120 ohms. Wrap the 1m lead wire around the can and tape end to keep the wire from dangling. A collection
area is provided by the TA. Place your
cans into it. At the next lab period
these cans will be wired to the USB 6229BNC unit and tested.
The soda can will act as R4 in the Whetstone bridge
circuit. The other 3 resistors of the circuit are provided on the plate at each work station.
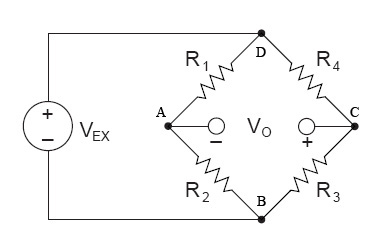

Figure 4: Wheatstone bridge configuration with R4 acting
as strain gage.
Determine how you will connect the 3 strain gages on the plate and the soda can to build the circuit of figure 4. Use a two wire (i.e. the black and white wire twisted together as one) connection for the 3 gages on the plate and a three wire connection for the soda can gage (red goes to D node of figure 4, black goes to C and white goes to the VO + ). When ready for testing, you will use an analog output channel from the 6229 (or the 2310 power supply, Signal Conditioner,) and adjust the excitation voltage to 5 V connecting nodes D and B to the positive and negative power supply leads, respectively. It is important to measure both the excitation voltage and monitor continuously the voltage across nodes C-A. The voltage drop across nodes D-B is the excitation voltage (about 5 volts) whereas the voltage drop across nodes C-A is virtually zero (when balanced or microvolts when strained). Consequently, gain is a real issue. If the excitation voltage were measured prior to entering the while-loop for monitoring the voltage across nodes C-A, then different maximum range values could be specified, figure 5. In this example a +/- 10 V range is reduced by about 2 orders of magnitude within the loop for reading the voltage created due to the strain gage change. (Note the USB-6229BNC unit has a minimum voltage range of +/- 200mV, or +/- 0.2V).
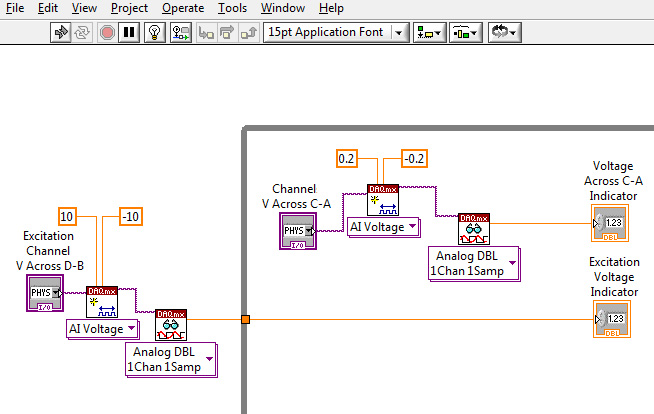
Figure 5: Connecting a Quarter-Bridge strain gage to channel 0.
The example shown in figure 5 is simple. However, it does not permit the continuous monitoring of the excitation voltage. An alternate method is to have two Analog Input Read functions, as shown in figure 6. They must be placed in a Stacked Sequence loop to prevent a conflict of available resources error. This type of loop required that all tasks within Stack Zero be performed then those tasks in Stack One, etc. In this mode, there is not a conflict for cpu resources.
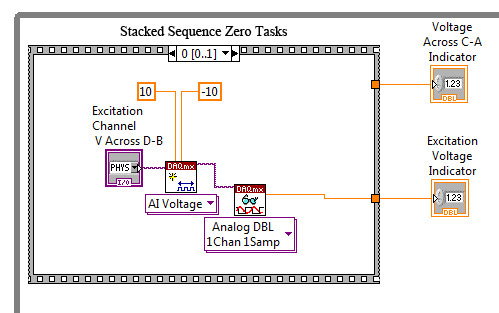
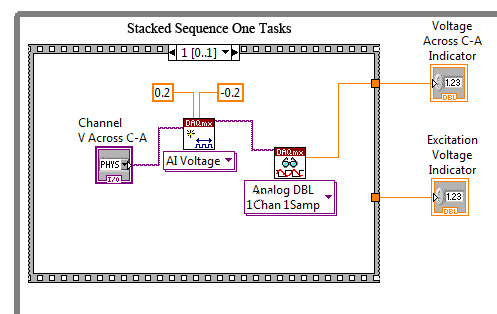
Figure 6: Stacked Sequence Allows a Voltage Read with +/- 10V range then a V read with +/- 0.2V range.
The voltage across nodes C-A should be zero initially, i.e. before the strain gage is strained. But the 4 resistors will not be perfectly balanced. Your virtual instrument needs a mechanism to zero out (or balance) the bridge. National Instruments discusses strain gage configurations and balancing. Similarly, your textbook discusses it too. Figure 7 shows one possible mode to balance the bridge.

Figure 7A: True loop of initial bridge balance.
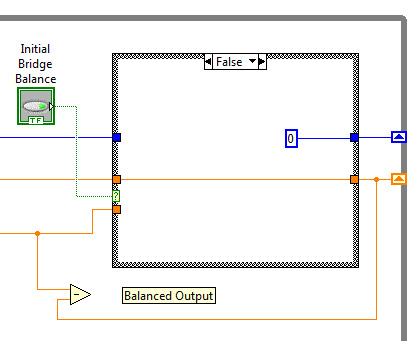
Figure 7B: False loop of initial bridge balance.
Essentially, the user starts the VI and pushes a toggle to start an initial bridge balance. The VI takes multiple readings (10 in this figure) of the unstrained system and maintains a running average. After an average offset is established, turn off the initialization process. Now all subsequent readings would subtract the averaged initial offset from the reading providing a neutral, balanced output. There are advantages (quick, inexpensive, etc.) and disadvantages of this method, but it will work very well for our situation. Several items to study in figure 7. On the left and right sides of the while loop there are down and up arrowheads. These are shift registrers. Create them by right clicking on the while loop perimeter and "add a shift register". (They get added as pairs.) Shift Registers allow variables to be used in the next while loop iteration. Right click on the left arrowhead with the wire tool and create a constant. This value will be used as the initial value prior to the start of the while loop. Follow the logic and see how the running average is determined. Use the LabView help to get more information on shift registers.
At this stage, our bridge is balanced and from lecture we know that  and we know that
  . We measure the change of voltage with respect to the excitation voltage. So we can rearrange and solve for the change of R and then the strain.
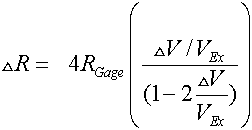
The programming logic
of the strain VI is shown in the diagram view of the VI, Fig. 8.
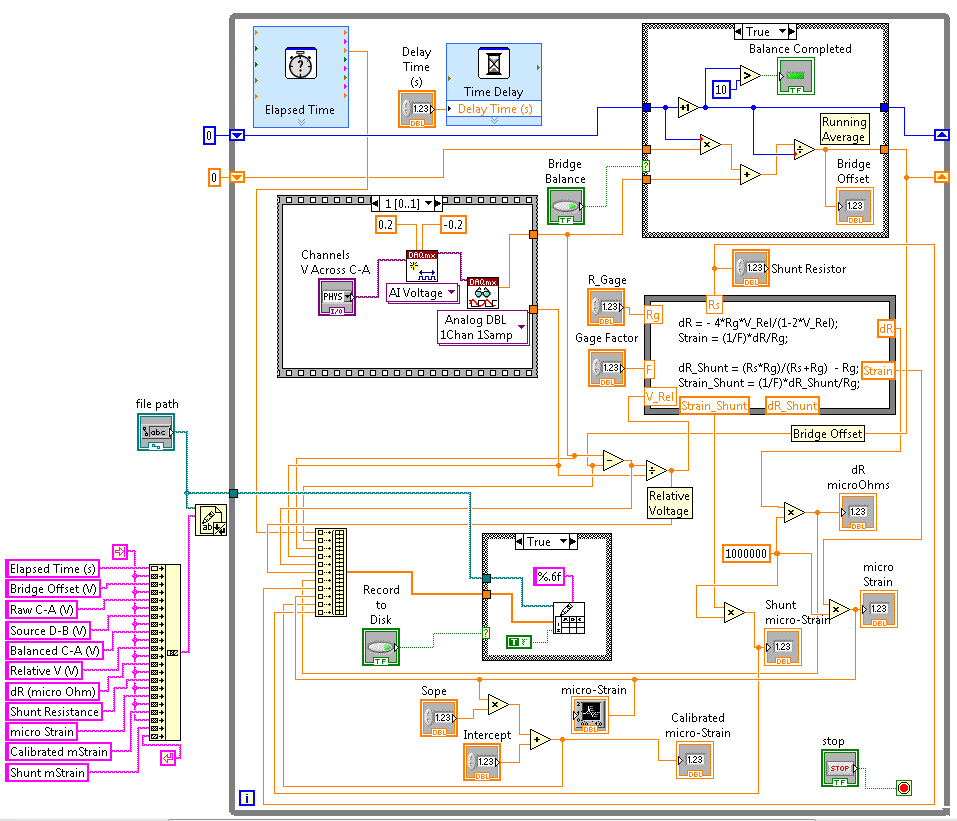
Figure 8: Diagram view of strain.vi.
Once
the unit is balanced and you've checked the accuracy of the bridge circuit you're ready to perform the experiment! Be sure your chart has Y autoscale turned off and you can record +/- 1500 micro strains. One could place the write-to-spreadsheet component into a true/false loop similar to last weeks lab. With the VI running and balanced it is time to calibrate the bridge. One can add shunt resistors to simulate known strains and compare the measured-strain (x-axis) to the known-strain via shunt resistor (y-axis). Insert at least two different shunt resistors and perform a linearization on these results to create a slope and intercept for the calibrated-strain final output. After adjusting the slope and intercept on the VI, and recording to disk, flip the lid of the soda can and watch the change in strain readings. Stop the VI, check that all your data appears
intact and reasonable. Repeat the procedure
for the other soda can.
A possible sequence might be:
A) Wire the bridge circuit with the soda can as R4
B) Apply power from the 6229DAQ or the 2310 Power Supply and set it at 1 Volt across Nodes D and B, respectively.
C) With DVM measure V excitation and verify that it is the 1 volts.
D) With DVM measure V difference between nodes A and C of bridge (should be virtually zero).
E) Run VI and record to disk for a few seconds
F) continue recording and push the initial bridge balance.
G) when "Balanced Completed" turns on, turn off the bridge balance option.
H) continue recording to disk for a few seconds, then Stop recording to disk, but continue running the VI
I) Insert Shunt A (whatever shunt resistor you decided upon)
J) Record to disk for a few seconds the strain measured due to the shunt resistor, then turn off recording.
K) Insert Shunt B (another resistor)
L) Record to disk for a few seconds the strain measured due to the shunt resistor, then turn off recording.
M) Repeat if another shunt resistor is also being used.
N) Get slope and intercept of measured strain on the x and known strain (i.e. the shunt strains) on the y axis.
O) Enter the slope and intercept into the VI and begin soda can test.
P) Start recording to disk, wait a few seconds, then pop the soda can lid, wait a few seconds, and turn off recording.
Q) Switch soda cans (if you have a partner), rebalance the bridge, and perform step E through P again.
With
this data collected the following items can be determined:
The pressure in the soda can,
The hoop stress of the pressurized can.
The longitudinal stress of the pressurized can.
The uncertainty of the pressure result.
REFERENCES:
1. Baumeister, T. and L.S.
Marks, Standard Handbook for Mechanical Engineers”, Chapter 5, McGraw-Hill,
1967.
2. Measurements Group Inc.,
“Student Manual for Strain Gage Technology”, Bulletin 309B,
3. National Instruments, Getting Started with
SCXI, Part No. 320515C-01, June 1996.