Engineering Experimentation
Design and Construction of a Virtual Ohm Meter
* Objective
* Background
* Lab Procedure
* Part I - Build Basic Ohm
Meter VI
* Part II - Build Enhanced Ohm Meter VI
* Lab Measurements
* Data for the Report
Objective
The objectives of this laboratory are to use LabVIEW to create an intuitive ohmmeter. Due to the constraints of our test equipment, that requires building a voltage divider. The user needs to configure a system so that external inputs (voltage, etc.) can be read by the DAQ (Data AcQuisition - generally conversions of analog/digital or digital/analog) system. The user will create a Virtual Instrument (VI) to measure analog inputs, display in analog and digital forms and create a file of resistor values. The digital readings will be transferred to a spreadsheet for statistical analysis. You will also observe the effects of temperature versus resistance characteristics for a batch of carbon film resistors.
Background
The background
information for this lab involves
a) analog-to-digital
conversion (what is the effect of a 12 bit compared to a 16 or 24 bit DAQ board?),
b) How to read and measure the resistance of a resistor, and
c) how to build a voltage divider and vary voltage to measure a range of resistors.
Lab Procedure
In this lab, you will write a LabVIEW virtual instrument (VI) program to read, display, and record resistance values of a variety of resistors. The idea is to build an instrument that works like a digital and analog ohm meter. Use your meter to verify the DAQ resolution of your system.
Part I - Build Basic Ohm Meter VI
How is resistance measured? Recall Ohm's law. Voltage = Current (amperes) times Resistance (Ohms), i.e. (V = IR). If we supply a known current, I, through a resistor, the voltage, V, measured across the resistor will be proportional to its resistance. The LabVIEW SCXI-1122 hardware has the capability to generate a constant current, I, equal to 0.001 amps (1 milliamp). (This is, in fact, the only value that it can generate.) For a resistor with a value, R, = 1,200 Ohms, the voltage drop across it will be, V = 0.001*1,200 = 1.2 volts. Note that the higher the resistance, the higher the voltage required to pass a given current. The SCXI equipment has a limit to the power (P=IV) that can be put through the system, approximately 5mW. This power limit will dictate the maximum resistance that can be measured. (You might have a resistor that exceeds (i.e. over saturates) the equipment rating. If so, what happens?).
The USB 6229BNC only reads voltages. It can provide constant voltage that the user can specify. It does NOT have a constant current source. You can specify a constant voltage from virtually zero to +/- 10V provided the power limitation is not exceeded. There is a maximum current of (5-10) mA available from the unit and you must continuously check that you are not saturating the device. If you do, your results might be inaccurate.
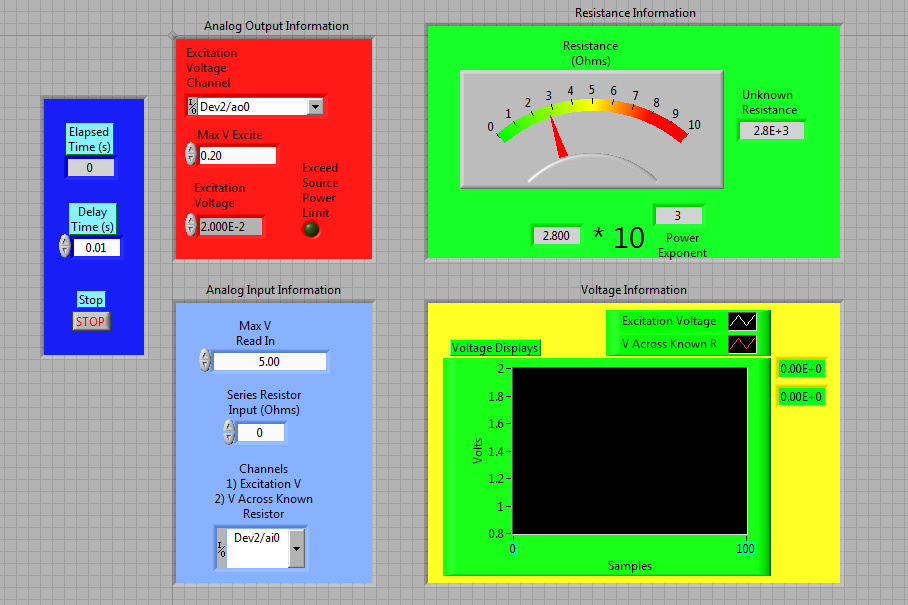
Basic Ohmmeter: Display Panel.
Create a vi that displays resistance on a meter similar to that in Fig. 1-1. Unfortunately, the analog display meter cannot have its range adjusted automatically through the block diagram. If one could determine the resistance, represent it in scientific notation and display only the coefficient on the analog display with the power below (in the scale multiplier), it could make this display universal.

Figure 1.1: Possible Ohm Meter Display.
Ramp range cannot be changed automatically.
Consequently, a scale multiplier has been added.
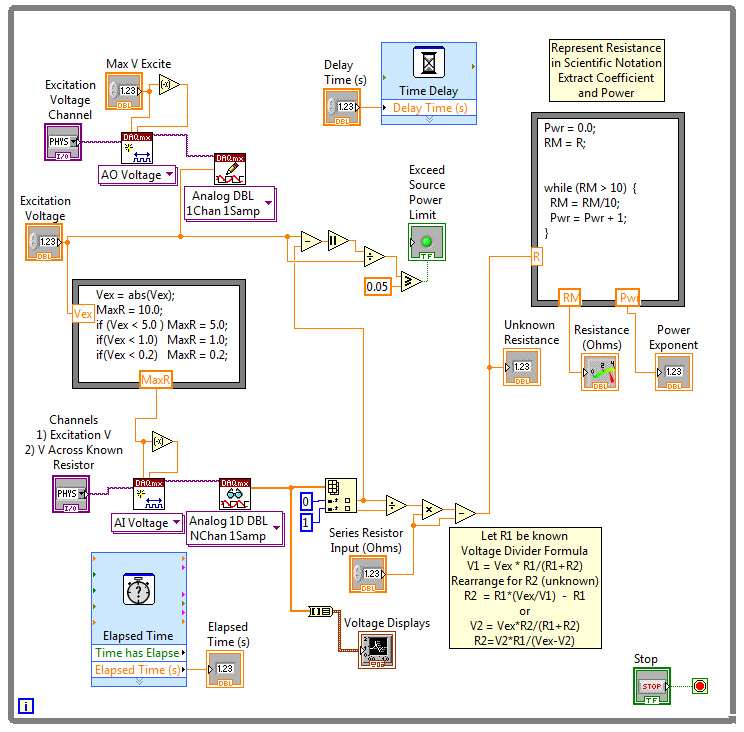
Consider a VI block diagram as shown in Figure 1-2. It features the ability to display the resistance in scientific notation as shown in Figure 1.1 It also provides a warning when the power source cannot provide the requested voltage. Follow the formula box. if R = 2800 ohms, then RM=2800, which is > 10, therefore it could be 280 x 10. this still fails the while loop so it divides by 10 again and increments the power, i.e. 28 x 102. This too is still > 10, so the while loop (within the program box loops again finally giving) 2.8 x 10³. The number (2.8) now satisfies the loop so it exits the formulat box, i.e. 1 < 2.8 < 10

Figure 1.2: Block Diagram of a Basic Ohm Meter
If one creates the VI as in Fig 1.2, examine how the R2 is calculated: R2 = R1*(Vex/V1) - R1. There are other ways of calculating R2, namely, R2 = R1(V2/V1). Is there a difference in calculating the unknown resistor, R2? If so, why. In your VI, read a 3rd channel for the voltage across R2. Then add this reading to calculate R2. Which way gives you a more reliable value?
Now that you've performed multiple labs, the front panel can be 'decorated' and organized more than previous entries, perhaps.

Figure 1.3: Front Panel using controls -> 'modern' -> 'containers' to organize various aspects of panel.
Numerous options exist. Experiment!
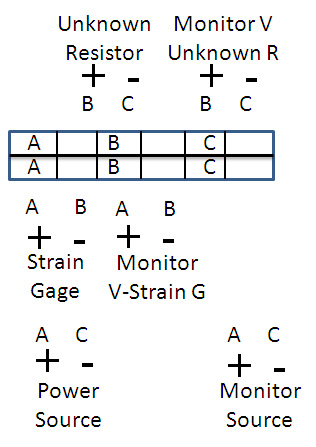
Use the 3-strain gage plate center connectors to place an unknown resistor in series with one of the known strain gages. (It is easiest if you configure a cable with aligator clips on both ends like your shunt resistor situation for the unknown resistors.) Supply a voltage across the resistors. Monitor the voltage of the source and both voltage drops across the known strain gage resistance and unknown resistor, Fig 1.4.

Figure 1.4: Wiring schematic for voltage divider
Measure the resistance of the unknown resistors. The excitation voltage might need adjustments to stay within the power capabilities of the system for various resistors and for the greatest accuracy. Note the color coding on the resistor. Use the resistor color code to decipher the resistor value. Determine if the resistance is within tolerance of the coded value.
Part IIb - Build Enhanced Ohm Meter VI
Ohmmeter Enhanced. Add sampling controls and other nifty options.
Now enhance the Ohmmeter's features:
- Add a write to file option to the VI. There should be a toggle to write to a file or not to write. (You've done this before. Therefore, it is not shown specifically.) Note! It is very important to set the output format of the saved data to give the appropriate level of precision. Recall that the write to spreadsheet defaults to floats with 3 digits beyond the decimal point. In general specifying a %.6e format would cover all situations since it is scientific notation. Record (time, Max V excite, Max V Read In, Vex, Vstrain-gage, R1, R2-Color Code, R2-Actual) to disk.
- A control that can enter the Resistor Color Code information which will be written to file as well. (You've done this before too. Therefore, it is not shown specifically.)
- A control loop that can vary the Analog Input voltage range. This loop is desired to maximize the resolution of the readings. (Do not implement this last part until you have collected data for your Bit Resolution analysis.) Something like the following figure might address the Analog Input V limits.
- Note: in the Scientific Notation node the "While (RM < 1)..." was removed. If R2 is less than or equal to zero, the code would get stuck in this formula node. Other error traps could be used, but most resistors have values of 1 or greater. therefore, removing the first while condition is not an issue, but it does eliminate a potential endless loop.

Figure 1.5: A functional node can be used to vary the Max/Min limits Automatically
Bit Resolution Analysis
Take one of the resistors from the package labeled Batch #. Note the color coding. Use the resistor color code to decipher the resistor value.
Measure this resistor with your VI. Record the data (about 100 readings) to file (time, Max V excite, Max V Read In, Vex, Vstrain-gage, R1, R2-Color Code, R2-Actual). For all readings, you should be able to specify a time delay of 0.05 seconds. Therefore, after recording data for about a second, one would have 100 points.
How do we measure the resolution of our DAQ board? The DAQ board is frequently a 12, 16 or 24 bit resolution board. The DAQ 6229BNC has 4 voltage ranges for gain (+/- 10, 5, 1, and 0.2V). If AA batteries were being measured, the ideal Min/Max voltage would be -/+ 5 Volts. The least count is the input range divided by 2 to the power of the bit resolution (see lecture 1 notes). Adjusting your Voltage Input (or Read) Range and Vexcitation can enhance the accuracy and resolution of your reading. It is important to set appropriate limits for optimum resolution. Part of this experiment is to record data to illustrate the resolution of your reading for various setups. Include a discussion of this in your report.
Adjust your Vexcitation to be 0.2 volts or less and verify that you can correctly read the resistance of the resistor. Set your Max V Read In to be +/- 10V. take and record 100 readings. Change your Max V Read In to be +/- 5 V, then +/- 1 V, and +/- 0.2V. Each time recording about 100 readings. Use this data to verify the DAQ board resolution.
Now add part (c - Automatic adjustment of ranges) to your VI.
Lab Measurements
The resistors you will use are in two different packages. One marked Batch # with ten resistors of the same nominal value and the other marked Mixture with multiple different resistors. Be careful to return the resistors to their original plastic bag and seal the bag when finished.
Remember to save the VI settings that you want as default so that you don't have to enter them each time you run the program.
Verify that your meter is functioning properly. Do some Sanity Checks.
Check the following:
(a). Does it read 120 ohms (or very close) if you place a 2nd strain gage resistor in series as R2?
(b). With a batch R2 resistor connected, do the readings look about right? (By now you will have deciphered all of the resistors using their color coded data which includes an accuracy rating.)
(c). Do the files created by your meter agree with the front panel readings? (That is, did you record the correct data? Did you specify sufficient significant digits in the write-to-spreadsheet icon?)
(d). What happens if the resistor value exceeds the limits set in your VI?
(e). What happens if the resistor value exceeds the power rating of the system?
(f). Are you getting the precision you want in the recorded data?
Once you think everything is ready, record about 100 readings on each batch resistor and about 100 readings on each mixed-bag resistor.
Data for the Report
Resolution measurements: Take say 100 readings at a fast rate (0.05 sec/sample as an example). Plot these out on a graph. What can you determine from this data. Are there only certain values that show up in the readings? What is the significance of the spacing between readings. From this information compute the effective number of bits in the A/D conversion. Create a table of high limits vs. Ohms resolution.
Batch readings. Measure each resistor in the package. You should record and save approximately 100 readings of each resistor. Import them to a spreadsheet for analysis. Report average readings for each resistor, average and statistical values of the all the resistors in the batch. Compare the actual resistance values with the value and tolerance given by the color codes.
Using the statistical data compute the bias and precision errors for the batch of resistors.
Compute the probability that a resistor in the batch could have a value exceeding the tolerance value marked on the resistor.
Remember to include the Batch and Mix numbers in an appendix to your report for tractability.
Mixture readings. Take accurate readings of each of the three mixture resistors. Make sure the readings are accurate. Adjust the limits to give the best precision if your VI doesn't do it automatically. Report the values and whether they are within the tolerance specification marked on the resistor.
Resistance vs. temperature observation. Take one of the Batch resistors and measure the value at ambient temperature. Now hold it between your fingers to warm it up and take another reading. Does the value increase or decrease. What is the significance of this property if the resistor was attached to a constant voltage that caused the resistor to be heated up beyond its rating. Consider the sequence of heat vs. current and change in resistance.
Now you need to write a report of the lab. Separate files (such as the *.xls, *.vi, etc.) are also required as your raw data. But they are not part of the lab report.
When you write the report, you might find that you did not save as many screen images that you want for the report. You also might not have saved as much spreadsheet data. If so you need to repeat some of these procedures after normal lab time.
Use the software WinZip.exe to package your entire lab report and supporting data.
Go to the: [next Lab | chapter top | previous Lab | cover ]
Copyright ) J.M. Sullivan, Jr., (2004-2007).
All Rights Reserved.