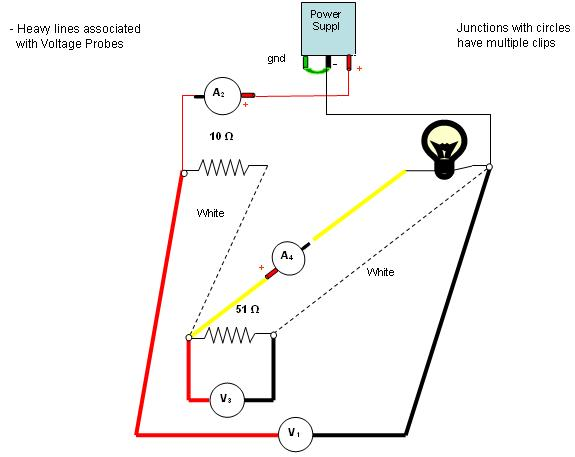
In this experiment you will be making current-voltage measurements on two similar series and parallel resistive circuits. The only substantial difference between the two circuits is that one will contain only carbon resistors (LINEAR resistive elements) and the other will have a light bulb (a NONLINEAR resistive element) substituted for one of the carbon resistors. This experiment will give you practice in figuring out current and voltage values in this series-parallel circuit, even when not measured directly, as well as acquainting you with the substantial difference between linear and nonlinear behavior.
In the first part of this experiment you are going to hook up a somewhat complicated series-parallel circuit made up of carbon resistors.
Hook up the resistor circuit (as shown in the Circuit Diagram and discussed by your lab instructor) involving three carbon resistors of labeled values of 10, 51, and 68 Ω. Please note that you are to include as part of the circuit a pair of current sensors for measuring electrical currents through two different parts of the circuit AND a pair of voltage sensors for measuring the electrical potential difference across two different parts of the circuit. With these current and voltage measurements, you will be able to determine the voltage across and current through each of the three resistors.

Open up the Logger Pro template, turn the voltage-adjust knob of the power supply fully CCW to the zero position, and then turn the power supply ON. Zero the reading and begin collecting data. Use the Keep Function to collect data from 0 V to 5 V in 1 V increments.
Perform a linear fit on the upper graph. Right click on the data box that opens up, select the "Linear Fit Options," and then select 5 significant figures and the "Show Uncertainty" choices. Record your results on the Worksheet. Once finished with the top graph, do the same with the lower graph, and record those results. Note that your result for the I1,V1 data set is the equivalent resistance of this parallel/series circuit, and the result for the I2,V2 data set is the actual measured resistance of the 68 Ω resistor. Note how well the datum points on each graph fit a straight line. Because the carbon resistors are so linear, ALL of the currents and voltages increase linearly as the voltage across the circuit is increased.
As you bring the cursor close to the upper-right datum point, it will become a small circle which can be accurately centered on the datum point. This will allow you to read the I,V values of that point, appearing at the lower left corner of the graph. Record those values on your Data Sheet. Then repeat that process for the upper right datum point on the lower graph.
With those two pairs of I,V values, you will be able to calculate the resistance of each of the three resistors used in the circuit. To do this, go to the Circuit Diagram and next to each resistor in the sketch, write down the respective voltage across it and the current through it. (Some of these values you have measured directly. The values not measured you can deduce from the set of measured values. For example, the voltage across the 51 Ω resistor is your measured V2 value, and the current through the 68 Ω resistor is your measured A2 value. And please be aware that the voltage across the 10 Ω resistor is NOT equal to the voltage across the entire circuit!) Given the numbers in this sketch, you will be able to calculate the resistance value of each resistor using Ohm’s law.
Make sure the voltage is down to 0 V and replace the 68 Ω carbon resistor with the #50 light bulb already placed in one of the light sockets (the second circuit diagram). Test that all the probes are reading correctly by turning up the voltage to about 4 V and back down to 0 V (each probe should read a non-zero value as you do this and the bulb should light up). Zero the readings and take data as you did before. Notice how the presence of the light bulb changes the shape of the data.

After you've stopped the collection process, turn the voltage supply control knob fully CCW to the 0V position. In the same manner as in Part 1, record the I,V values for the far upper right datum point on each graph, and do the same for the first non-zero datum point on each graph closest to the 0,0 point. On your Lab Report you will be asked to figure out the current through and voltage across each of the 3 resistive elements at both the high- and low-voltage points so that you can calculate a resistance for each element at both the high and low points in your data set in order to demonstrate the nonlinear behavior caused by the light bulb.