You have already worked with linear resistance during your last two lab sessions. Today we will move on to consider non-linear resistance as demonstrated by a simple light bulb. We will ask you to do a qualitative assessment of the power that is required by an LED versus the power required by a Light bulb. We do have an Emission Spectrometer which may help.
As you have seen, the carbon resistor is AMAZINGLY linear (constant resistance value independent of the voltage). So are ALL resistors of constant resistance value? Absolutely not! One of the best examples of a resistor that changes values with applied voltage is the light bulb—as the voltage increases, the temperature of the filament changes, thus causing the resistance to... well... It would be much better for you to find out for yourself how things change. And that is what Part 2 is all about.
There is a light bulb (labeled as #50—a round-headed bulb, NOT a long-headed bulb) in one of the three sockets mounted on the circuit board. Make sure that the power supply adjustment knob is set to zero volts (fully CCW), and change the clip leads from the resistors to the light bulb binding posts so that you can use the same circuit as in Part 1 to make I-V measurements in Part 2. When you believe that everything is properly connected, run the voltage up to 3 V and back. If the current increases with voltage AND the light bulb begins to glow at the top voltage value, then all of your circuit connections are probably OK (at least if the polarity of the Current probe is correct).
Go through the zeroing procedure, just as before, and then collect and record datum points for voltages of 0, 0.1, 0.2, 0.3, 0.4, 0.5, 0.6, 0.8, 1.00V, and then by 0.25V increments up to a maximum of 4.0V. (These voltages need only be adjusted APPROXIMATELY to the above values. Also, you should wait several seconds after adjusting the voltage to record the datum point in order to let the system settle down to each new current/voltage situation.) And as you are recording all these datum points as the voltage increases, please note the voltage level at which the bulb first begins to glow, and record that value on your Data Sheet.
Once you have finished recording all of the datum points, click "Stop", and then click the tangent function. Move the cursor horizontally to move the tangent line from one datum point to another. At each point the data box will give the slope of the tangent line (the resistance) at that point. Here are some conditions to evaluate: determine the voltage corresponding to the minimum and maximum resistance, and record these resistances; determine where the resistance value is changing most rapidly and record that information, also. For these three conditions remember to write down the resistance vales in Standard Form. (Hint! Consider using the Linear Fit Function.)
Now you have seen two wildly different examples of resistors—the extremely linear carbon resistor and the extremely nonlinear light bulb—and you have finished the data-collection portion of this experiment.
Several follow-ups you should consider:
In Part 2 you will measure the voltage-current relationship for an LED (Light Emitting Diode). In this case the circuit is modified slightly with a 220 Ω resistor in series with the LED. This is called a current-limiting resistor which will limit the current flowing through the LED so you don’t burn it out. Also the voltage is measured across the LED only (NOT the resistor), as shown in the circuit.

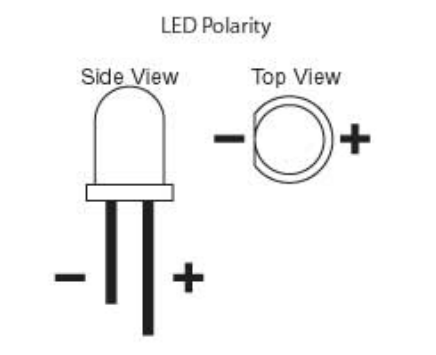
Note about LEDs: LEDs are directional and the longer leg of the LED is the positive terminal. Additionally, when looking at an LED from the top, the negative terminal is marked by a flat edge, as seen in the diagram below.

The red LED is located directly above the light bulb sockets on your circuit board, with the current limiting resistor directly to the right of the LED. Connect the circuit, and obtain the voltage vs current curve with the Logger Pro using the same procedure as Part 1.
Limit the power supply voltage to 5 Volts maximum. Note the voltage recorded by the Logger Pro is less than the power supply voltage because of the voltage drop across the resistor. Your curve should look something like the diagram drawn by the TA on the board. How does the resistance change as the voltage increases? How does this compare with the incandescent light bulb of Part 1?
Before you break down the LED circuit, turn up the power supply voltage to 5 Volts and carefully observe the intensity of the LED, and try to keep this intensity in your memory. Now, hook up the light bulb circuit of Part 1, and slowly increase the voltage until the light bulb shines with approximately the same intensity as the LED. This is somewhat subjective, so see if you can agree with your lab partner on the voltage.
Recalling that power P = IV, calculate the power of the LED and the light bulb when shining at the same intensity. How do they compare? Now you know why LED lighting is so much more energy efficient than incandescent lighting.