Research - Ground-water/Surface-water exchanges
Background
Any investigation of surface-water quality for a lake or pond requires accurate estimates of the contributing contaminant or nutrient loads. In many cases, inflow from the adjacent ground-water aquifer contributes significant portions of these loads. However, the loads that originate from ground-water aquifers are often difficult to quantify. Furthermore, the processes and pathways followed by contaminants as they enter the ponds are difficult to characterize.
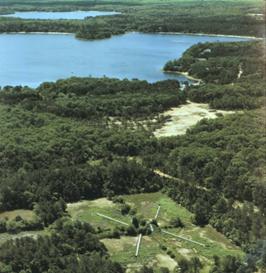
To gain a better understanding of processes controlling these ground-water/surface-water exchanges, the United States Geological Survey (USGS) has been investigating the discharge of phosphorous and other constituents from a sewage-contaminated aquifer into a pond adjacent to the Massachusetts Military Reservation (MMR) in Cape Cod, MA. A plan view of the region is shown in Figure 1 and an aerial view of the region is shown in Figure 2. The investigation has provided a detailed data set illustrating the vertical and temporal distribution on this discharge along the pond bottom where the contaminated groundwater enters the lake. It also provides an excellent basis for understanding the pathways and transport mechanisms governing contaminant transport.
Objectives and approach
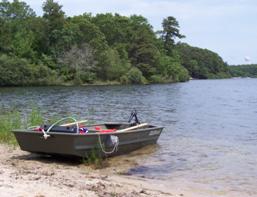
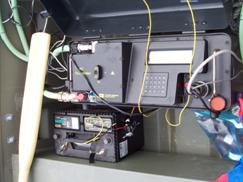
This research is intended to complement the USGS results by (1) providing additional verification of the nutrient concentrations and movement in groundwater, and (2) by including additional surface water quality data to illustrate potential pathways and impacts. The approach used here involved the analysis of surface water samples collected in the near-shore region of the pond, and the analysis of groundwater samples collected from multi-level samplers (MLS) located adjacent to the pond. Additional modeling was completed to provide indications of spatial distributions and variability of contaminated groundwater discharge. Analyses focused on nitrogen (including ammonium, nitrite and nitrate) and phosphorous compounds (total and dissolved phosphate). In addition, to provide some indication of the distribution of near-shore algal growth, real-time distributions of in vivo chlorophyll-a were obtained using a boat and a field fluorometer. The boat and Ashumet Pond shoreline are shown in Figure 3. The fluorometer is shown in Figure 4. Extracted chlorophyll-a values for selected locations provided a basis to estimate magnitudes of the in vivo chlorophyll-a values. By logging the fluorometer output in tandem with a Geographical Positioning System (GPS) unit while traversing the near-shore regions in a boat, real-time distributions of in vivo chlorophyll-a. Spatial representations of the results were developed in a GIS.
Some results
Results for groundwater samples were found to match the previous results well, and indicated that significant loads of phosphorous enter the pond from groundwater. Since total phosphorous tended to be higher than dissolved phosphorous, the phosphorous transport is likely affected by phosphorous associated with solids. Surface water samples indicated non-zero but low phosphorous concentrations in the water column. The in vivo chlorophyll-a results provided a useful approach for determining the nature of the phosphorous discharge. In addition, they revealed a correlation between regions of high chlorophyll-a and regions of high phosphorous discharge. An example is shown in Figure 5. The orange line represents the approximate location of a zero-valent iron barrier, intended to reduce phoshorous input to the pond. Trends in in vivo chlorophyll are seen to be aligned with the locations of this barrier. In particular, high concentrations are found in locations directly adjacent to the shoreline (over which the barrier did not reach. These trends appeared to be consistent with sampled data as well. The results illustrate the near-shore trends in nutrient discharge from ground-water into surface-water, and also illustrate the importance of defining the pathways that nutrients follow as they enter a lake.