- The Central Limit Theorem
- Basically, the Central Limit
Theorem states that if certain assumptions are satisfied, then no
matter what distribution a population has, means of data from that
population tend to be normally distributed. Mathematically,
if
 are
independent random variables from the same distribution with mean
are
independent random variables from the same distribution with mean
 and variance
  and if
then for large  ,
,
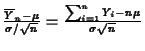 has approximately a
  distribution.
- Normal Quantile Plots
- A normal quantile plot is a
scatterplot in which the data are plotted against their associated
normal quantiles. If the data are normal, the plot should resemble a
straight line.
- Cauchy Distribution
- The Cauchy distribution is an
example of a distribution for which a variance is not defined (In
fact, a mean is not defined for it, either.) The probability density
function of the Cauchy distribution model is
Joseph D Petruccelli
2001-10-16