Visualization best viewed on desktop; on mobile you may need to scroll/zoom/pan.
I have completed my goal of running a marathon in all 50 states!
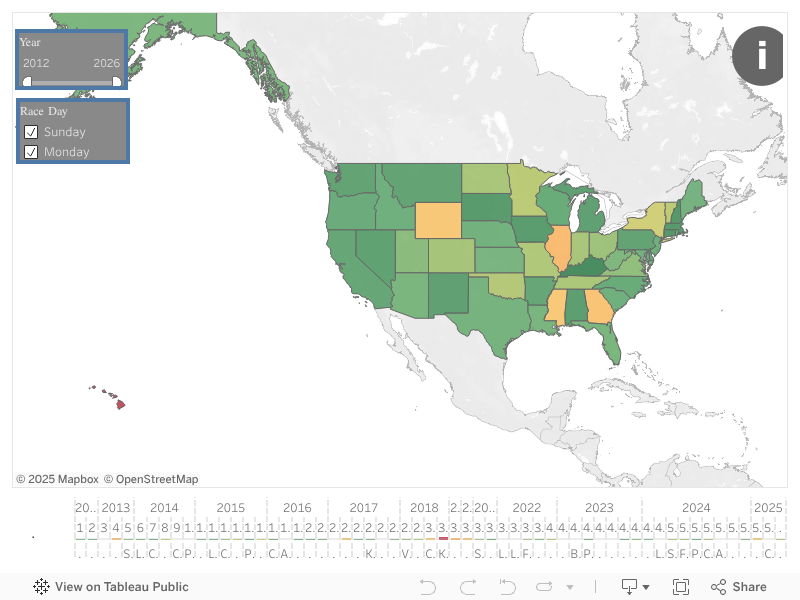
- The color spectrum of the states and bars represents finish times: darker greens are faster; lighter greens, yellows, and reds are slower.
- Hover over states and bars for more details about each race.
- The map shows the first marathon in each state; the graph shows all marathons in chronological order.
- The information (i) button displays overall statistics.