Plotting
Now let’s plot some functions, but first we should clear the workspace. Type clc into the command window and press enter. This command erases all user defined parameters. There are many so called housekeeping commands and a long list of other useful commands that will help you through this resource here in the Matlab Quick Reference. I suggest right clicking on that link and opening it in a new window. This way it will always be available as you tour the tutorial.
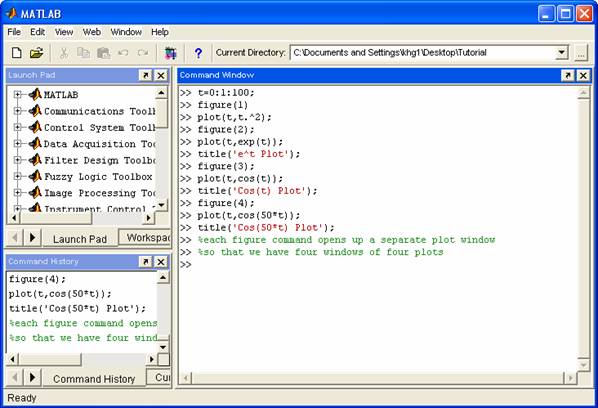
In the command window define an array t from 0 to 100 by an increment of 1. Command line t = 0:1:100;
Now lets plot: t2 et cos(t) cos(50t)
On the plot itself you can zoom in using the magnifiers for + and – in the toolbar of the figure window and then click and drag on the plot to select an area to view. As you can see the plots have titles. There are two ways to go about creating titles. One way is to put them in after the plot has been created by clicking edit and then axes properties. The other way is to add title and axes labels is in the command window after the plot command has been executed. Take a look:
title(‘Plot’);
xlabel(‘Time’);
ylabel(‘Amplitude’);
Wasn’t that exciting? Return to Matlab Tutorial.
![]()